



918 Colby Bluff Drive


About This Property
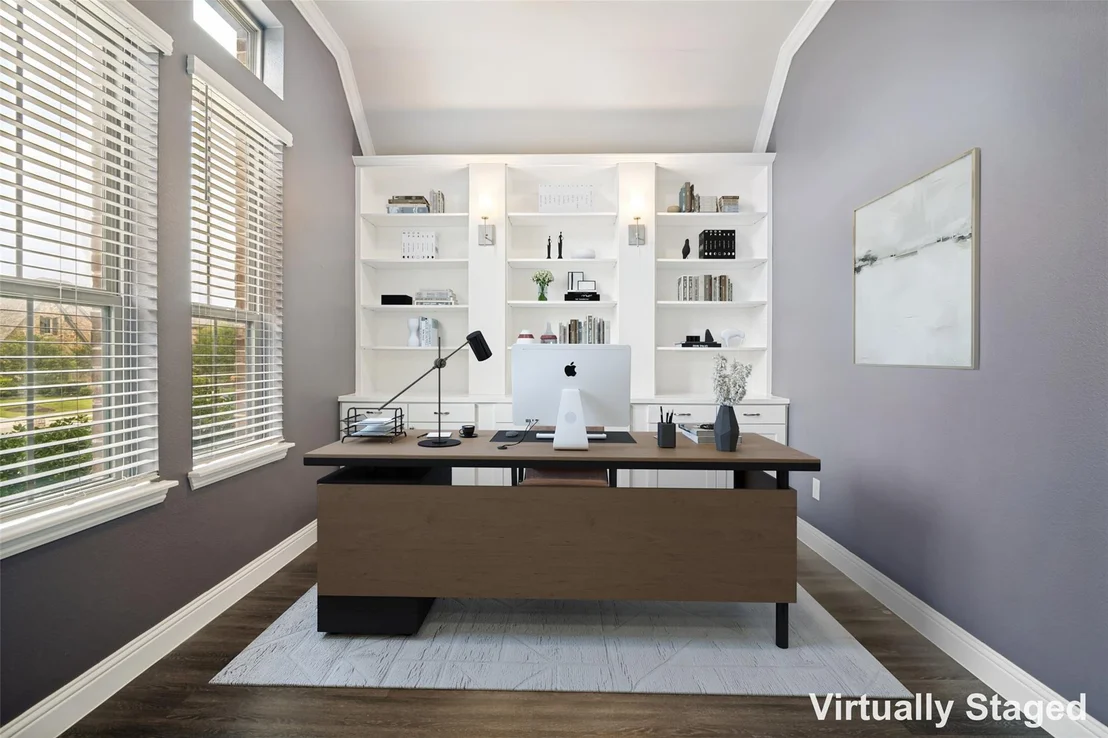
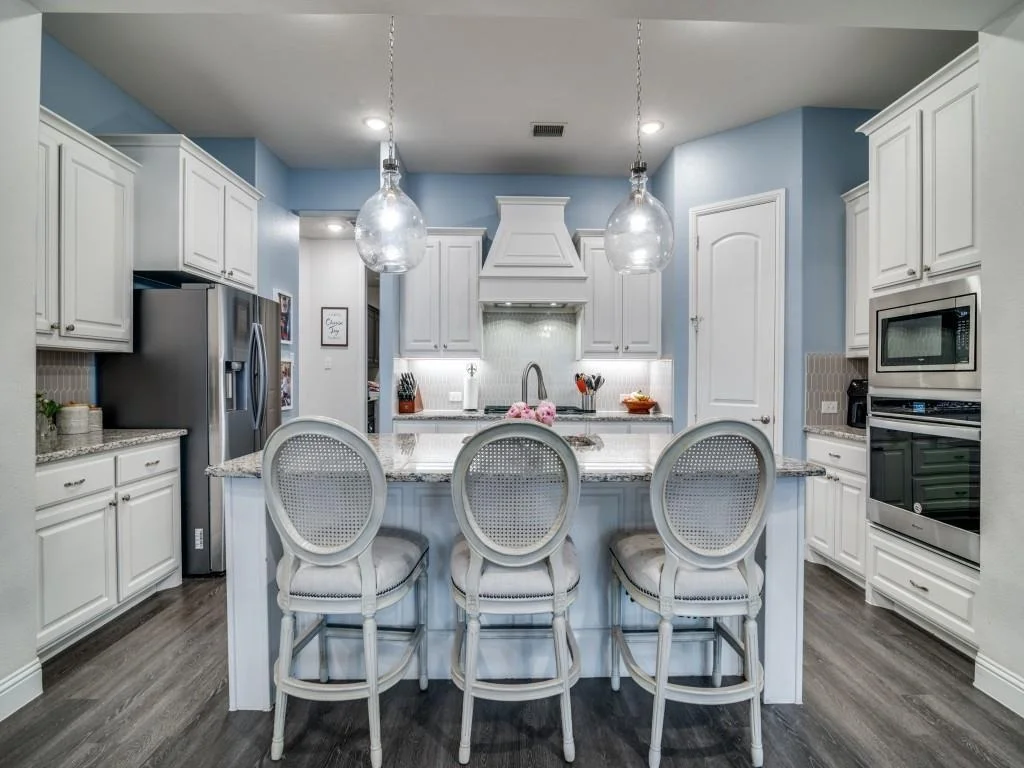
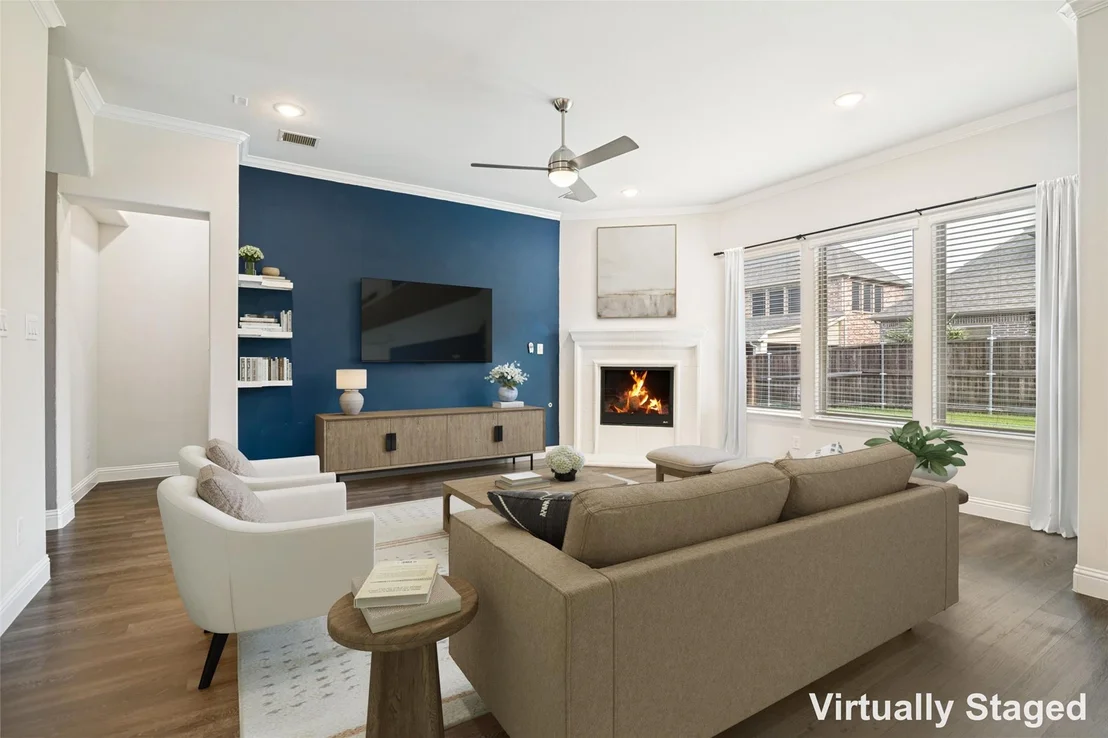
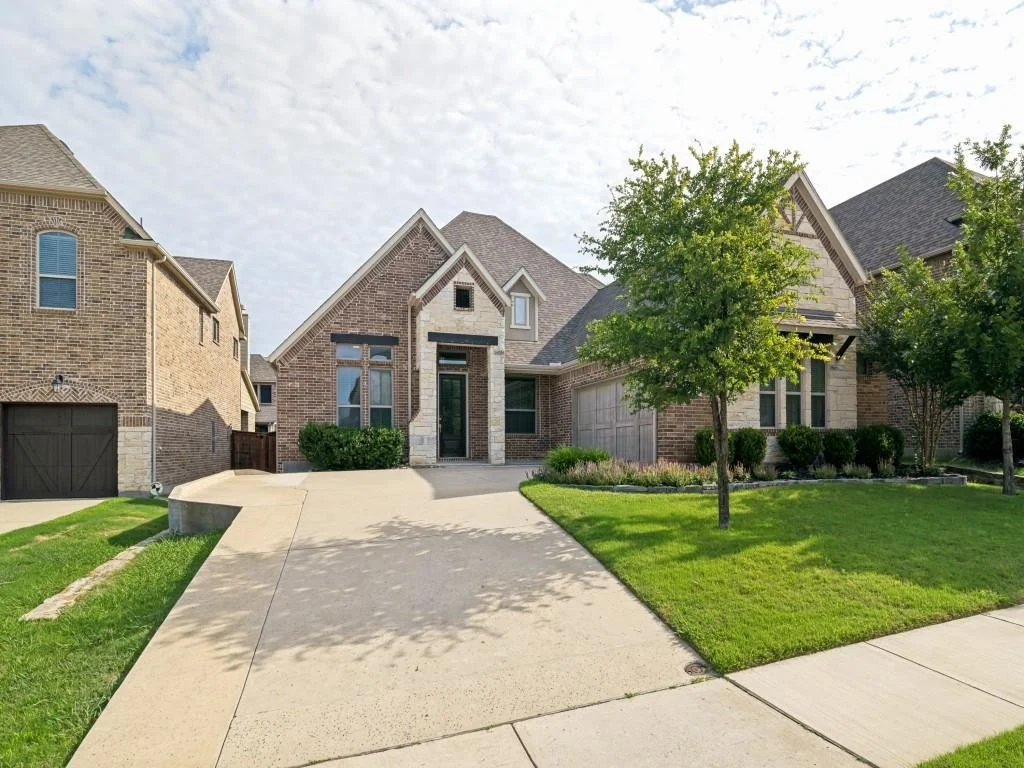
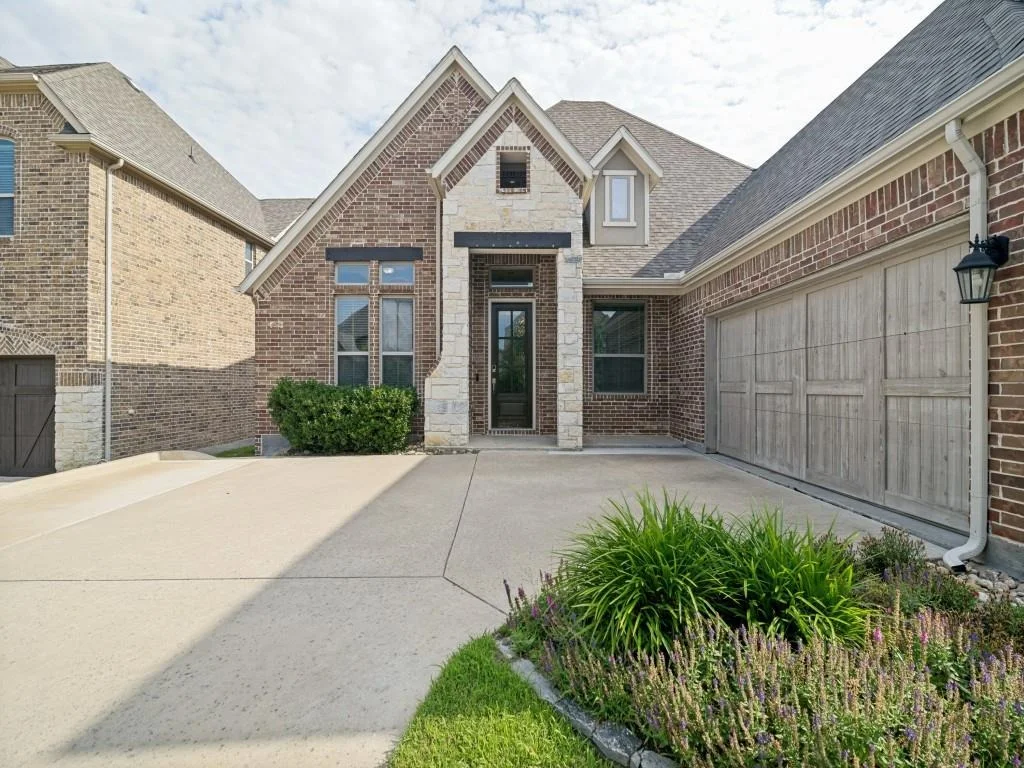
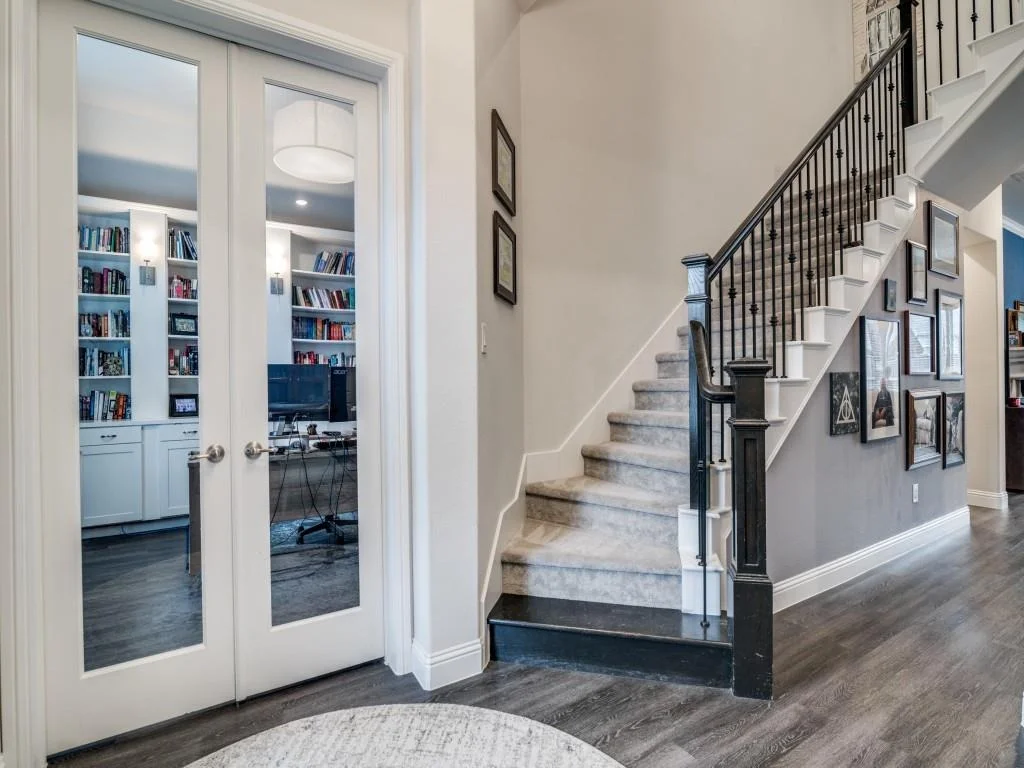
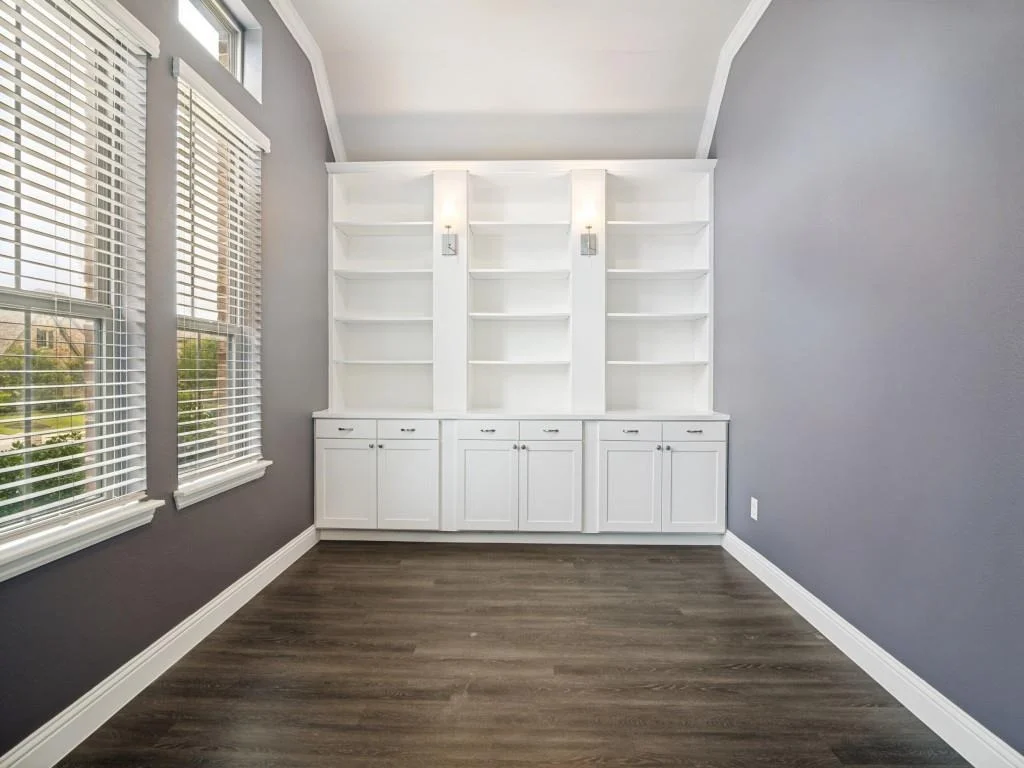
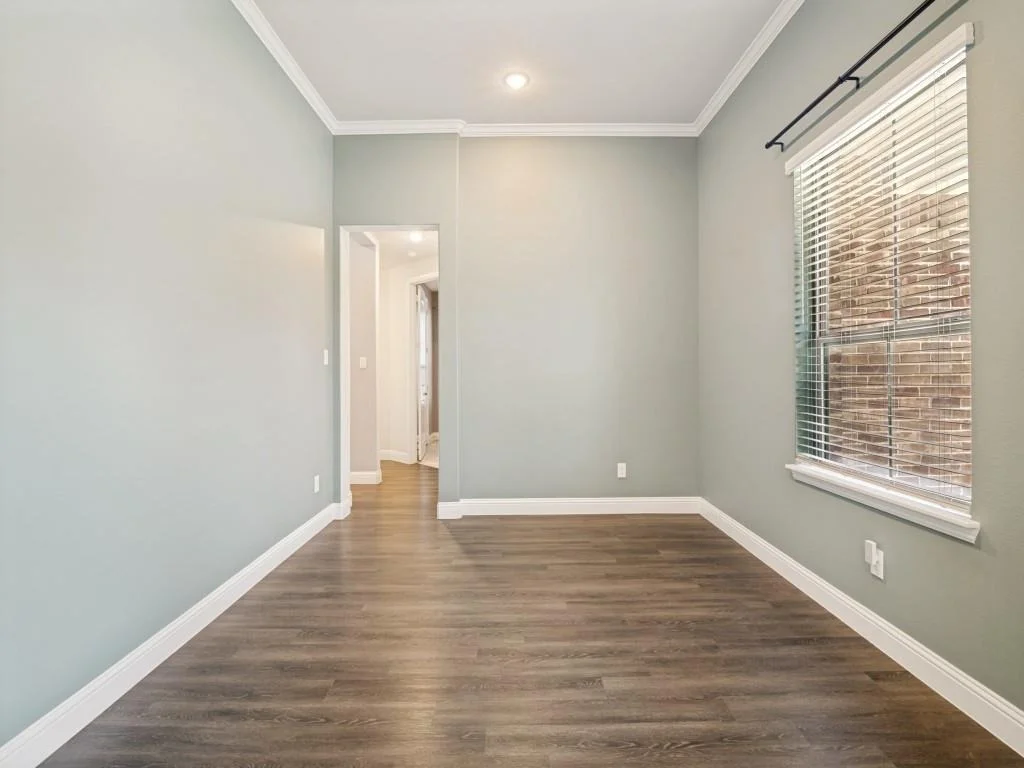
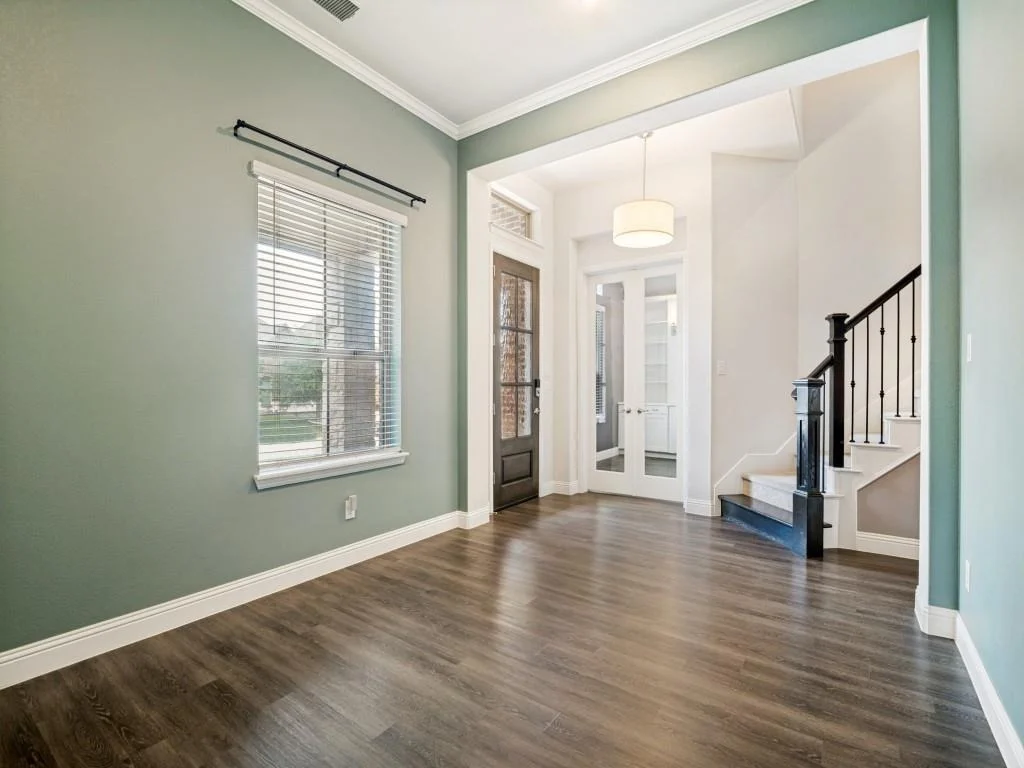
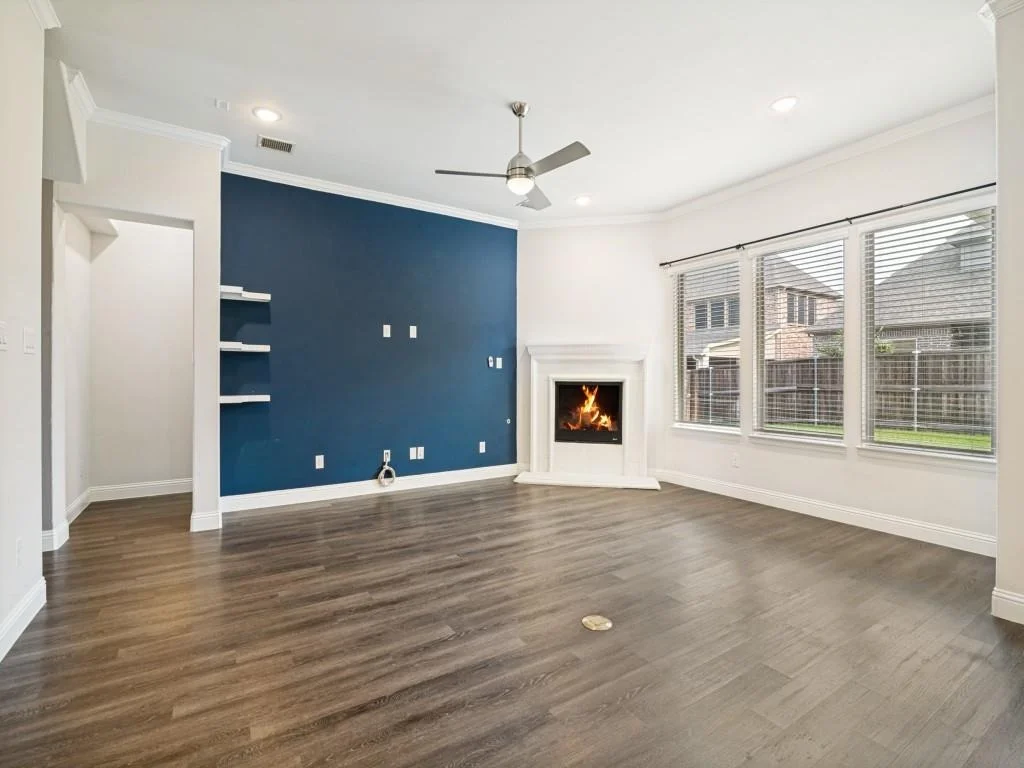
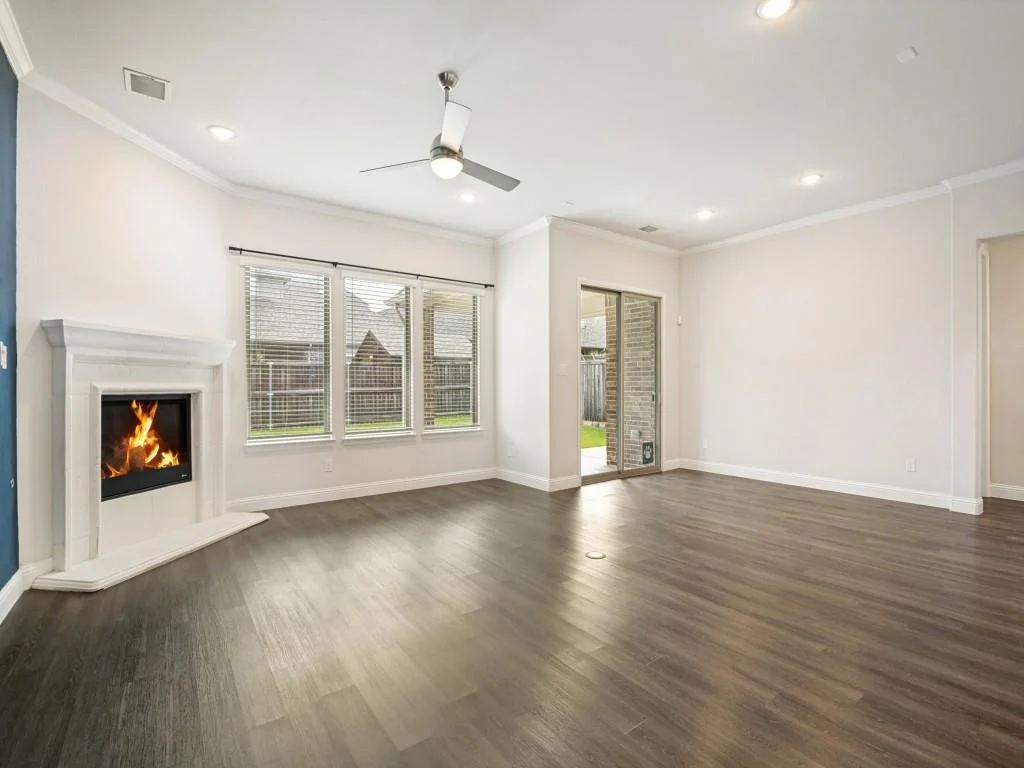
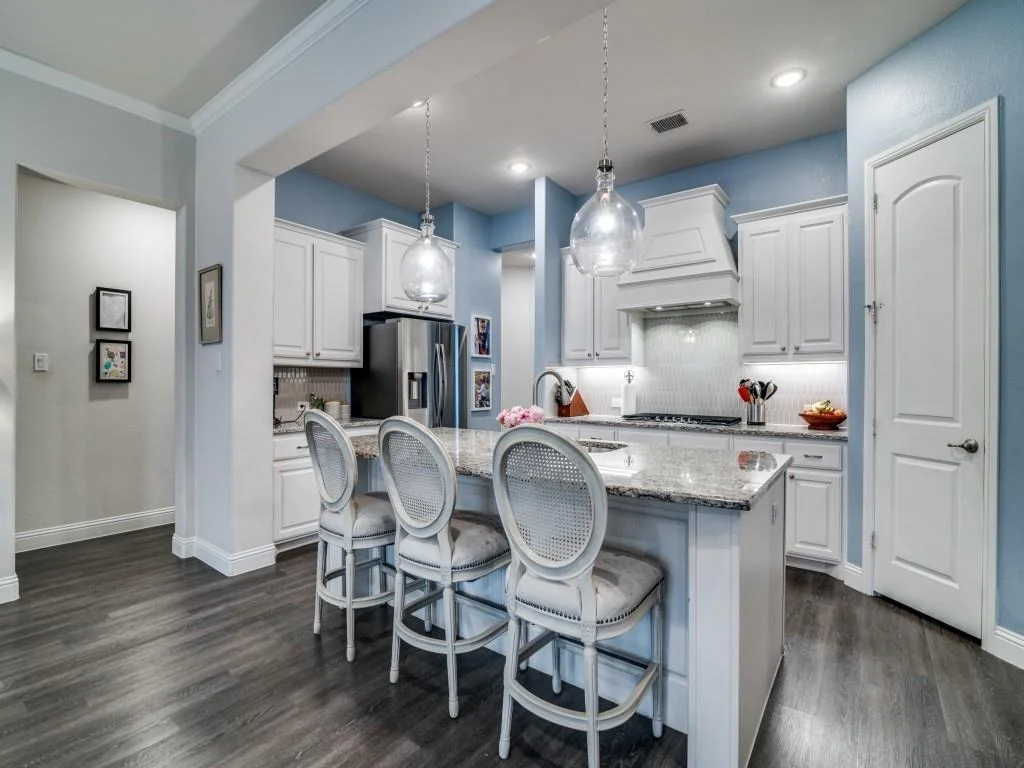
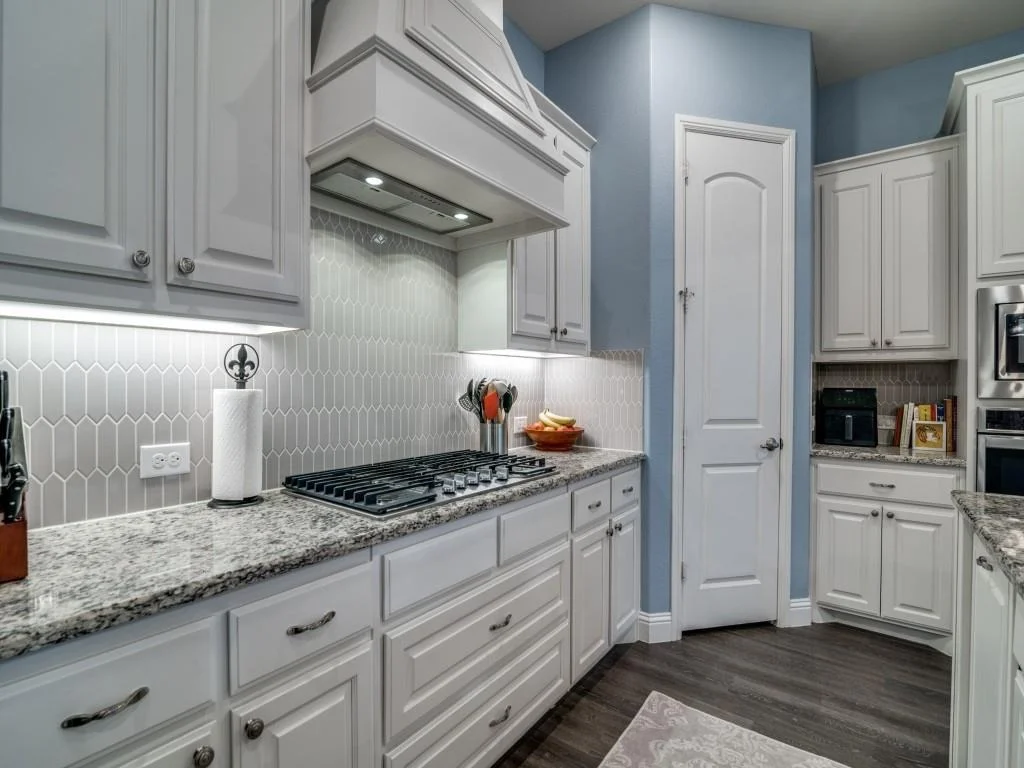
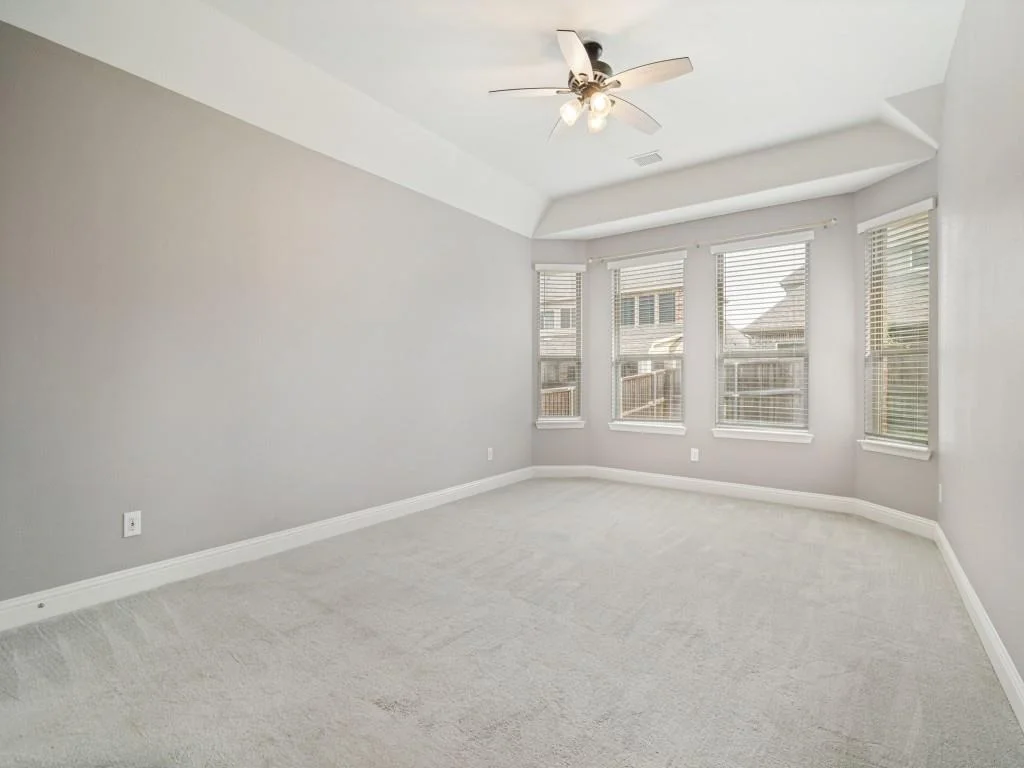
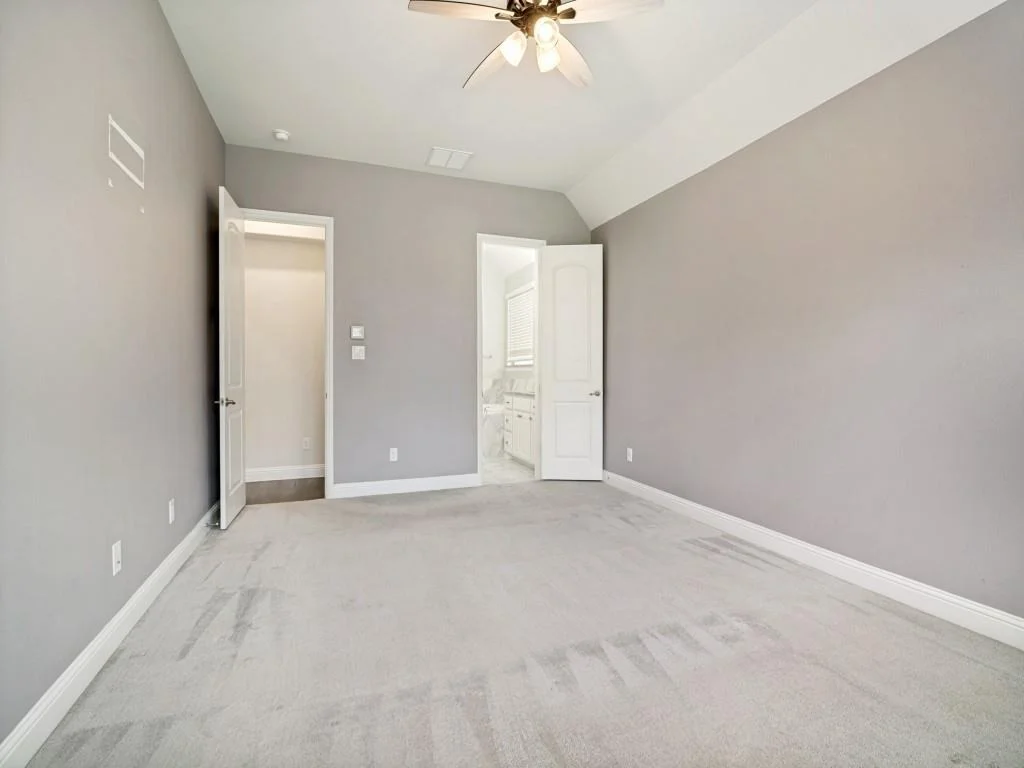
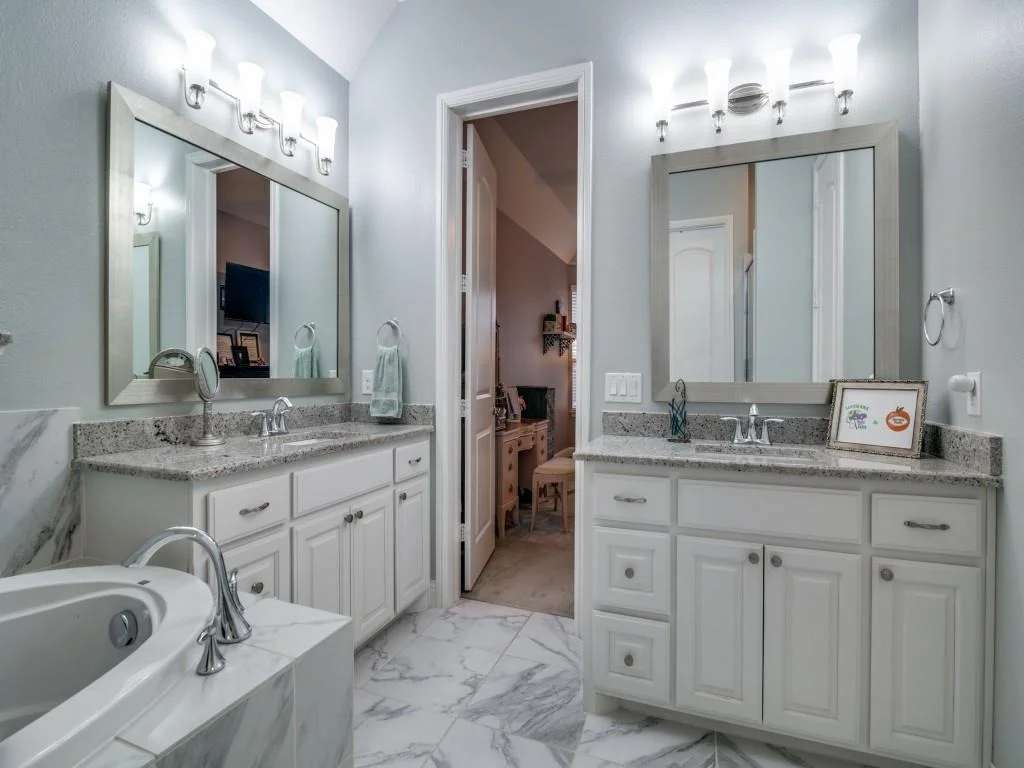
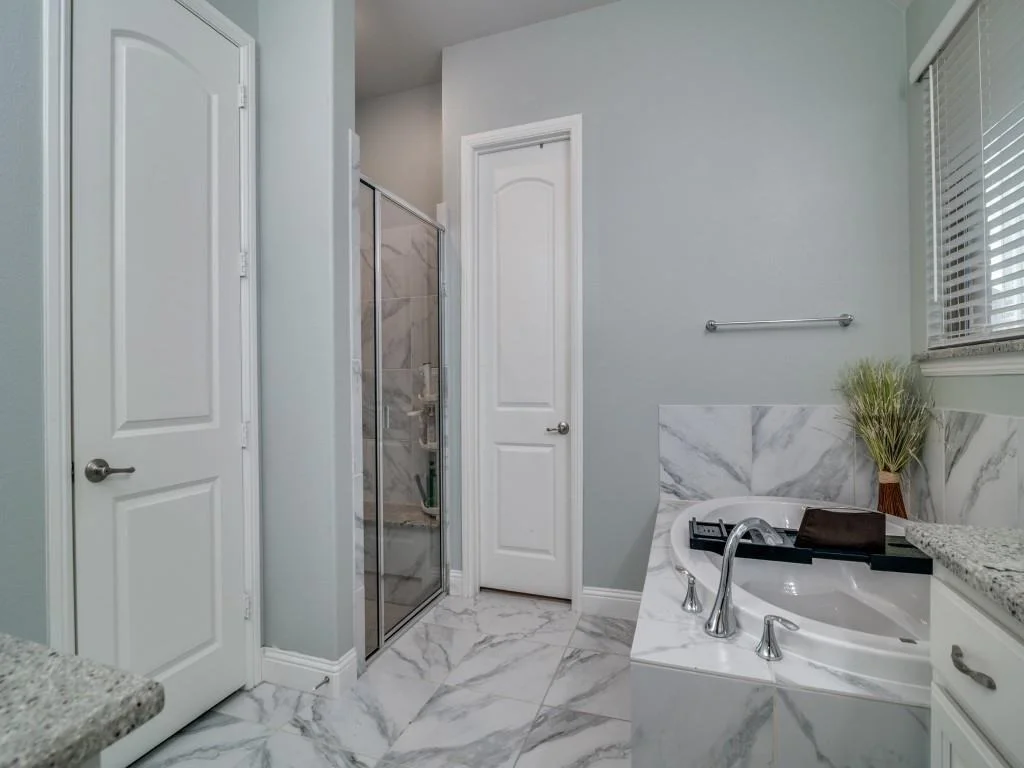
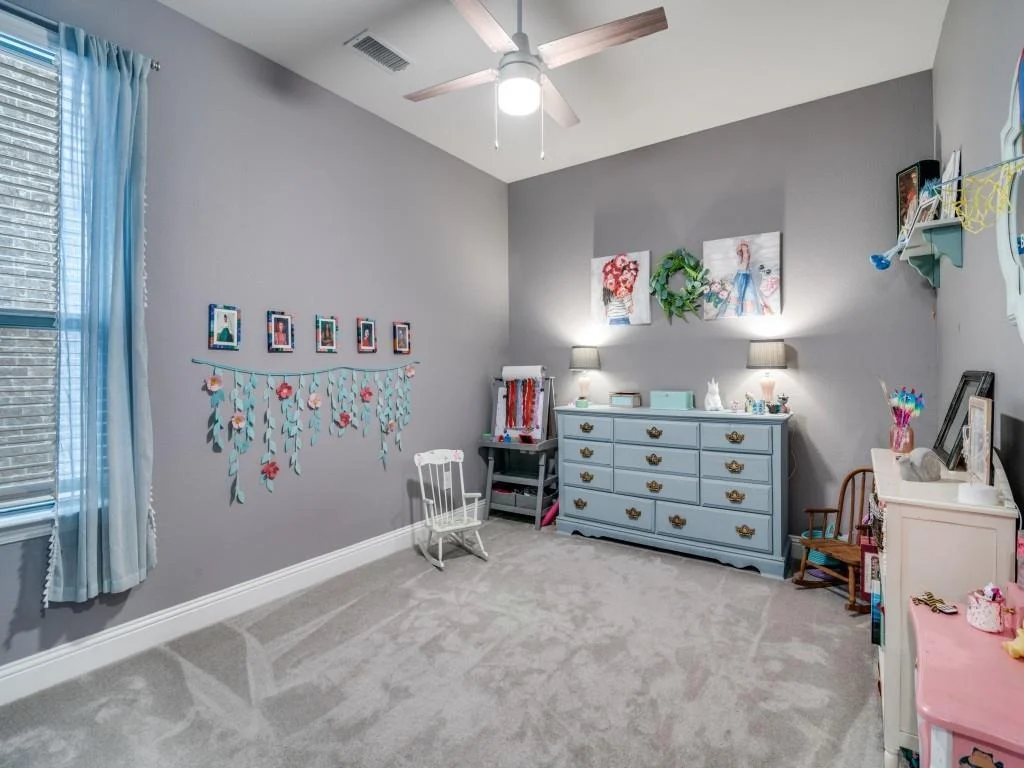
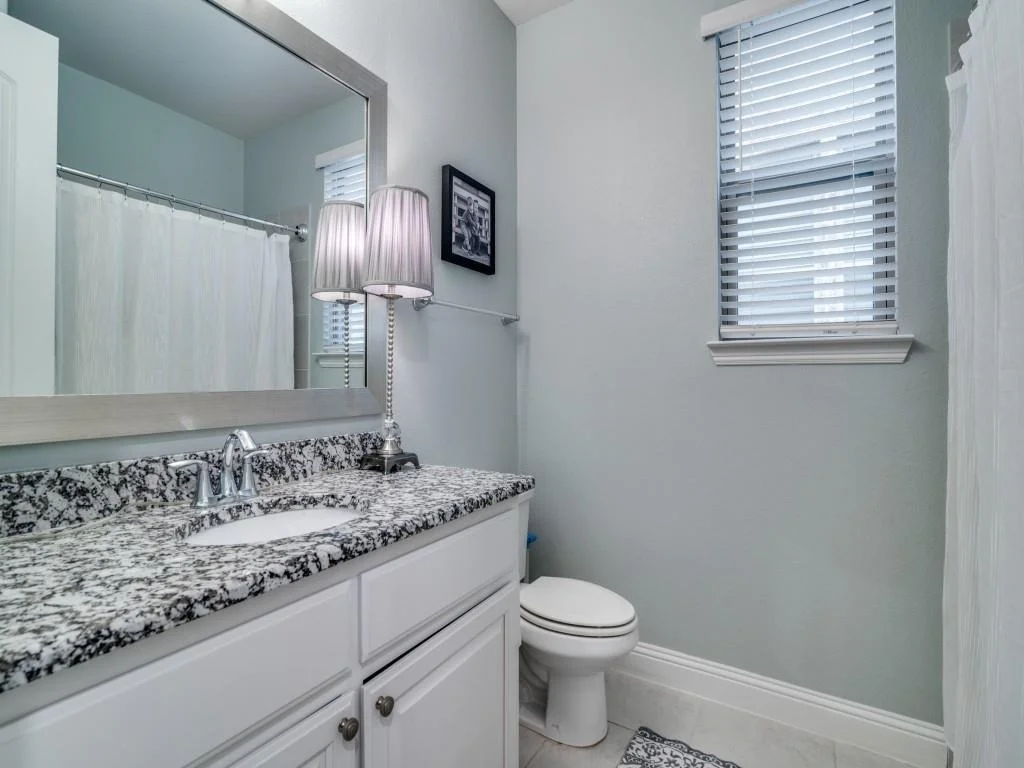
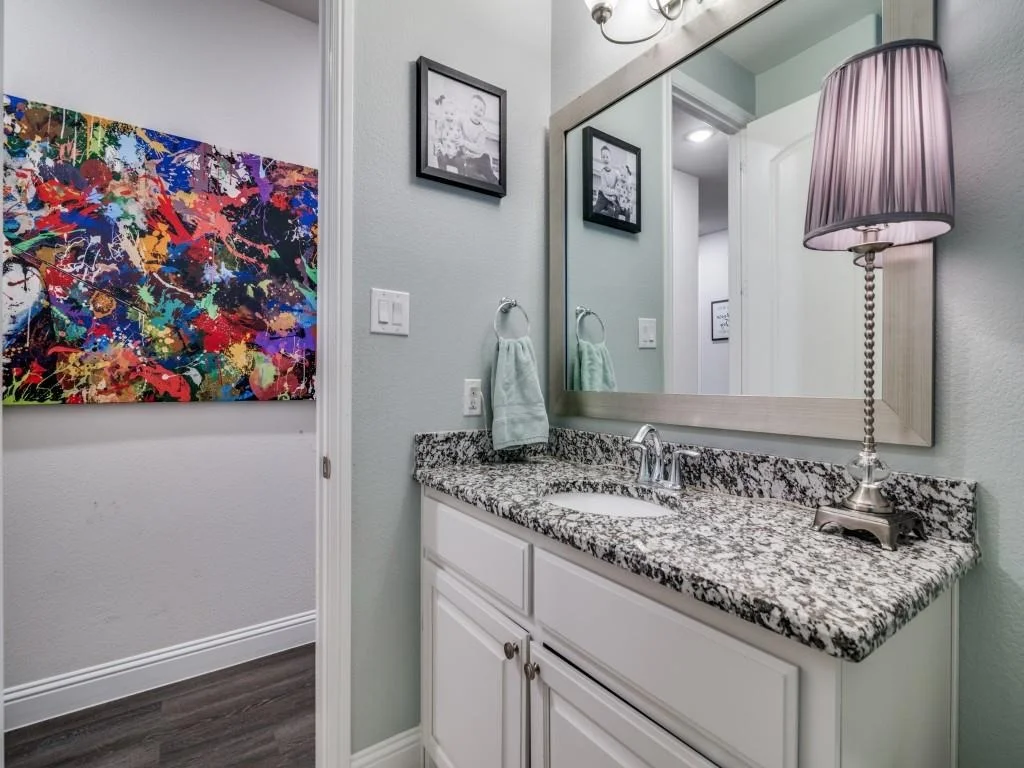
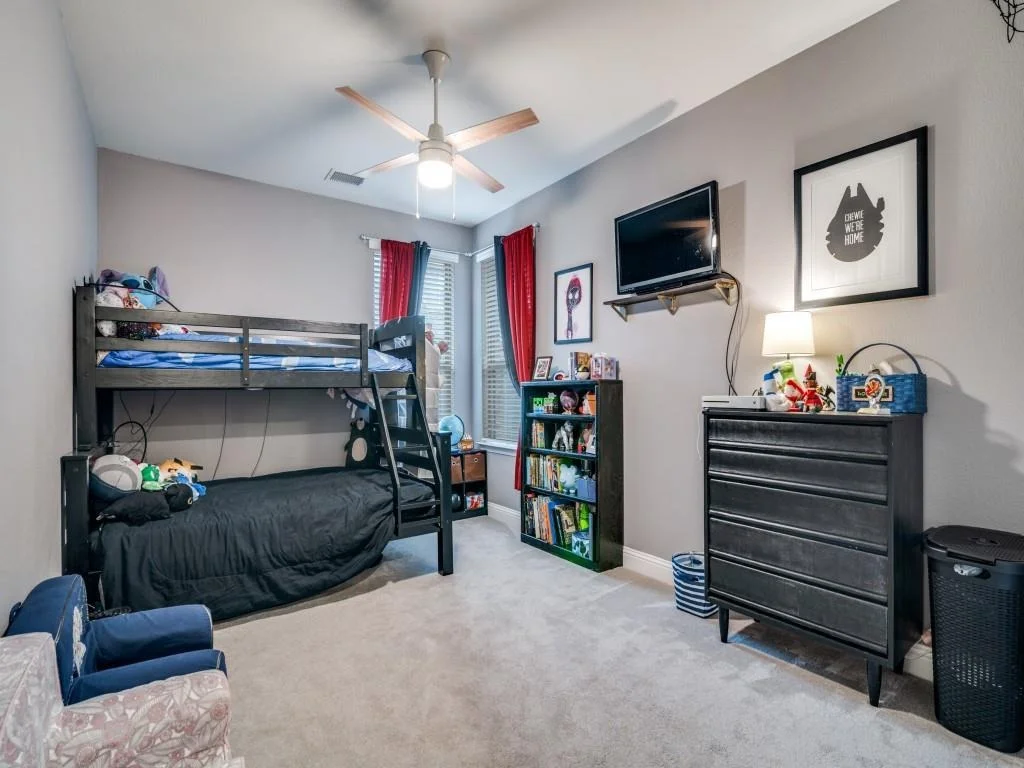
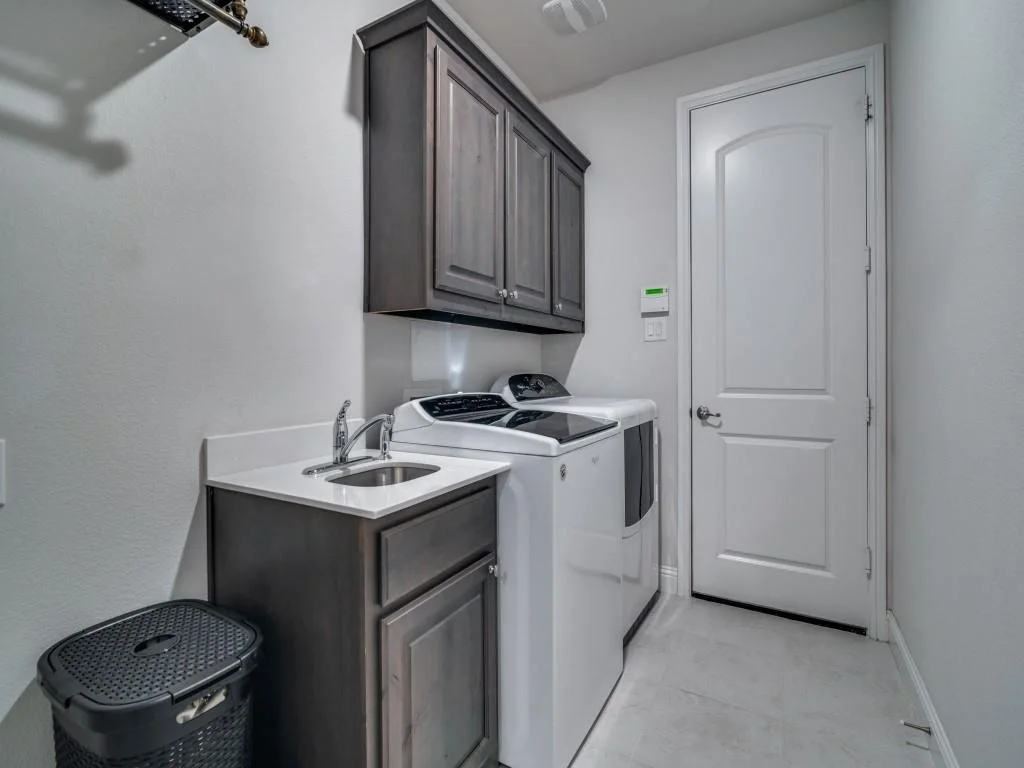
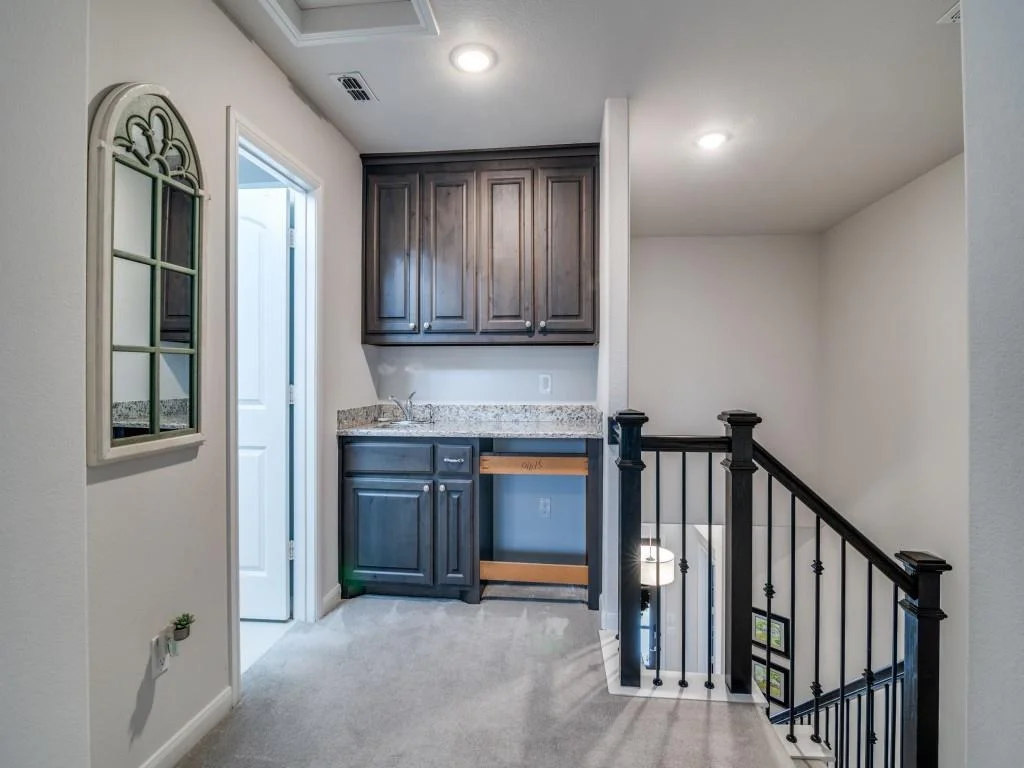
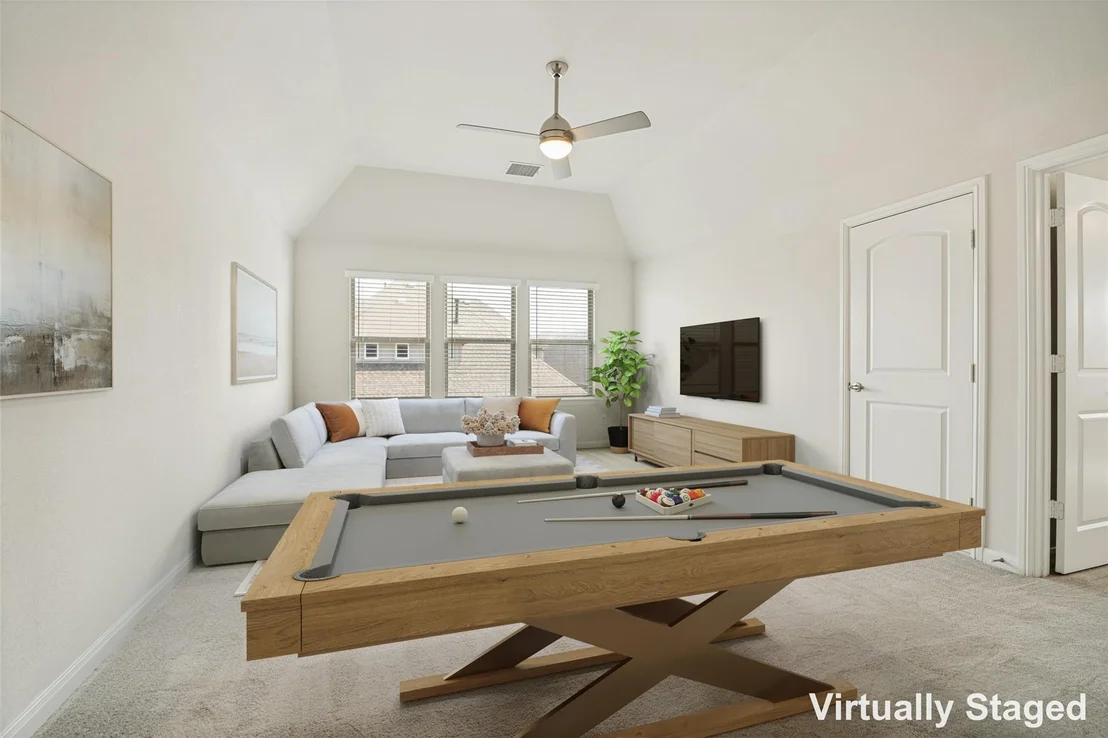
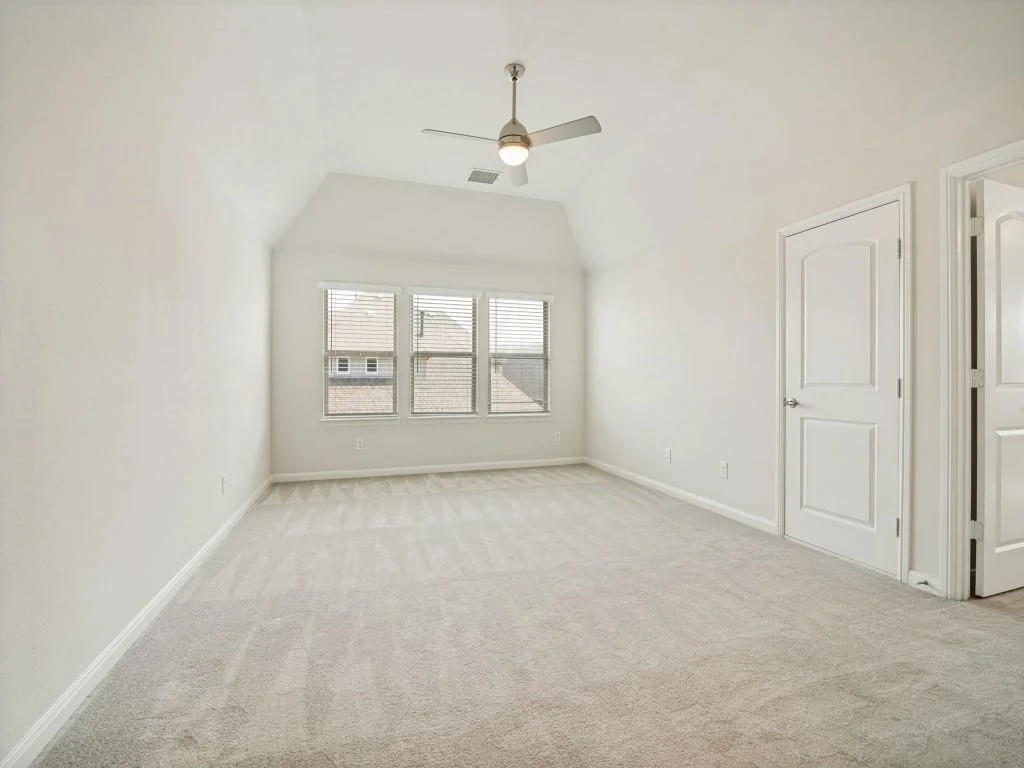
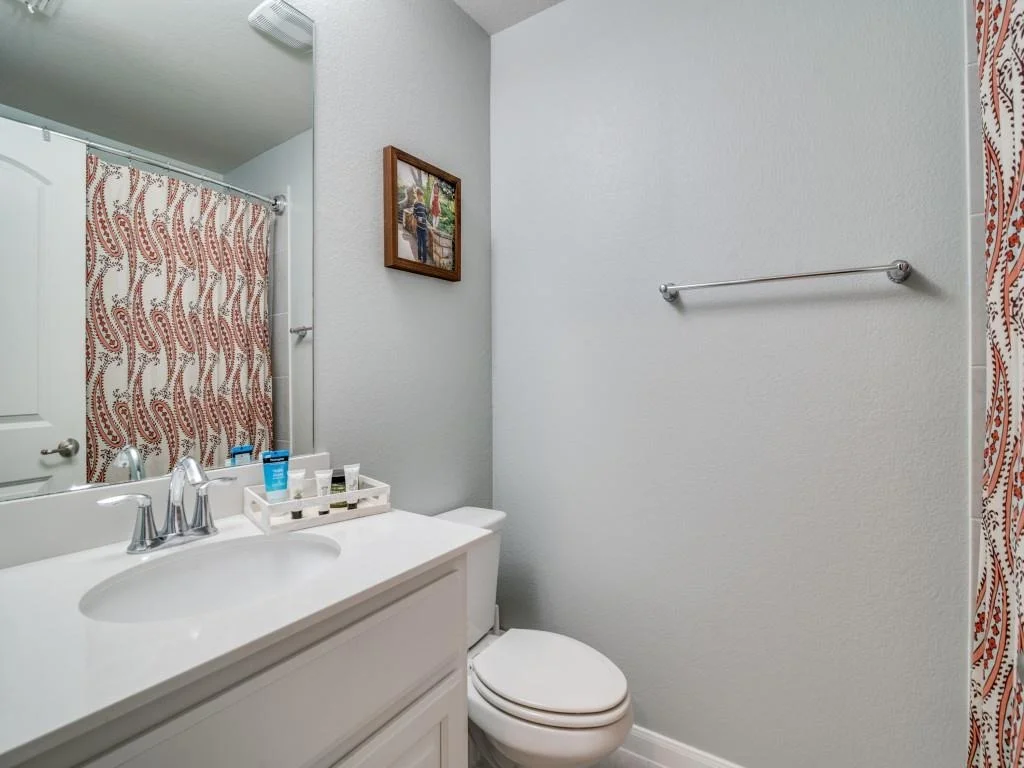
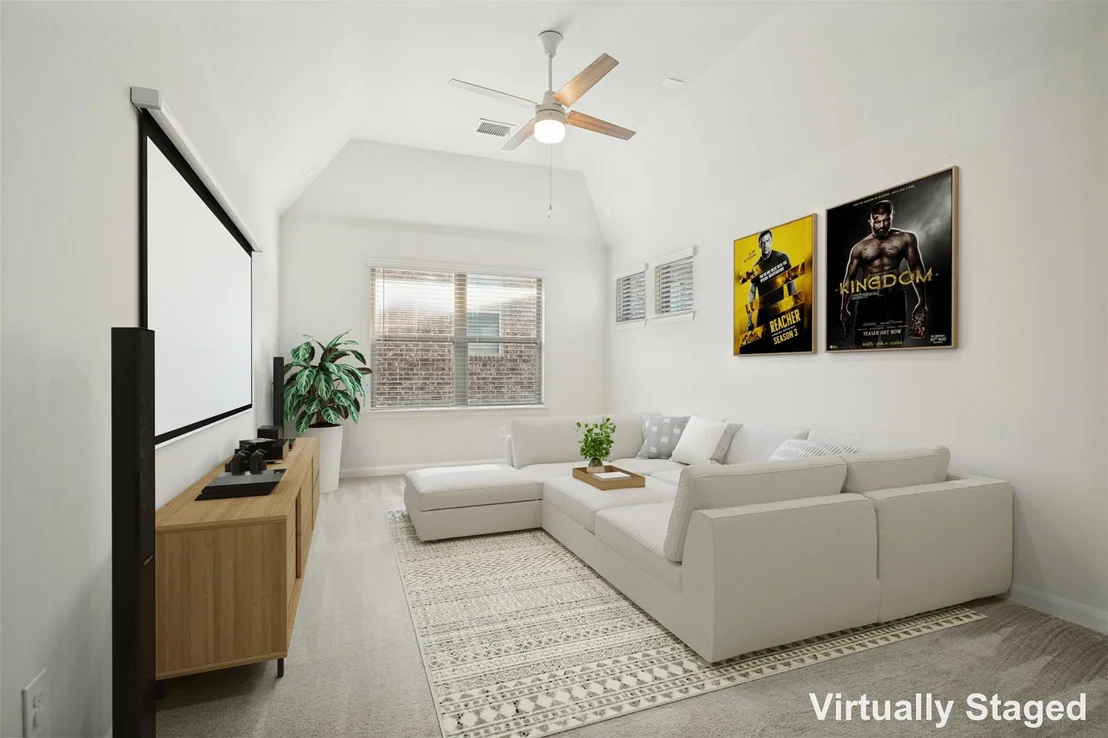
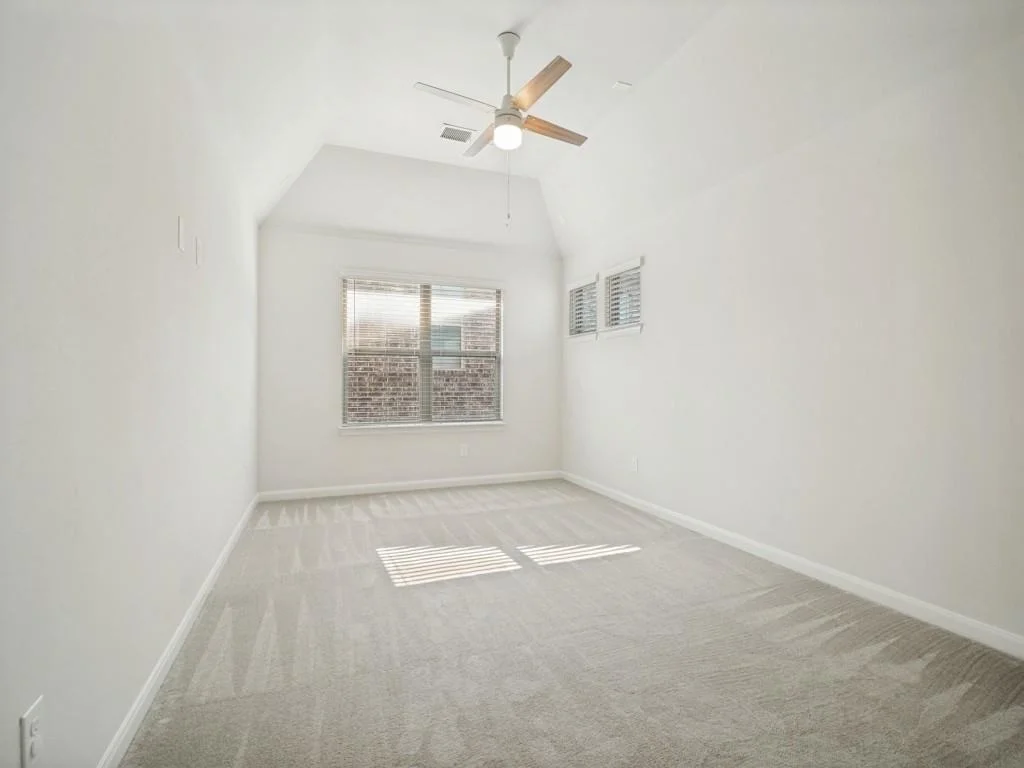
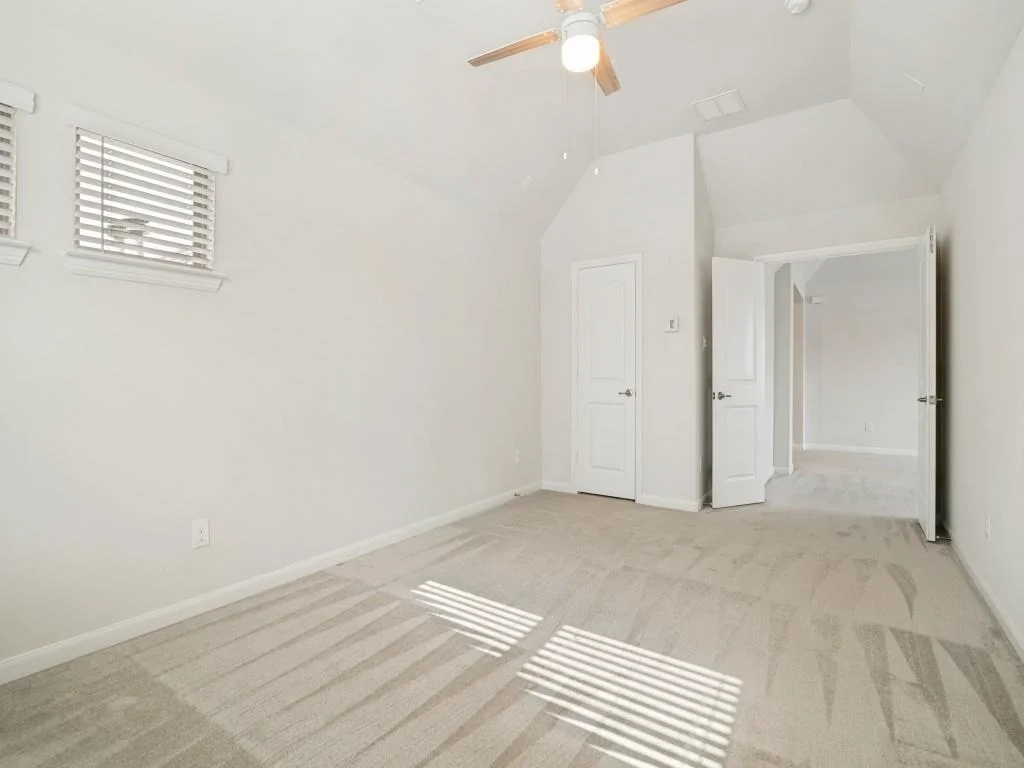
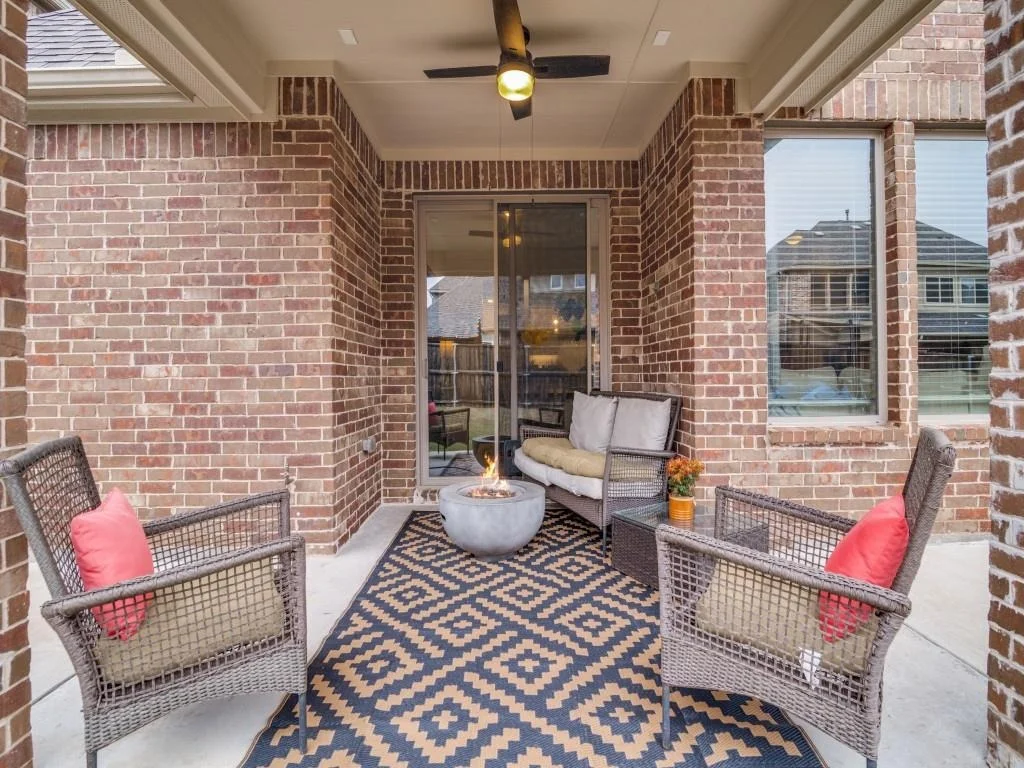
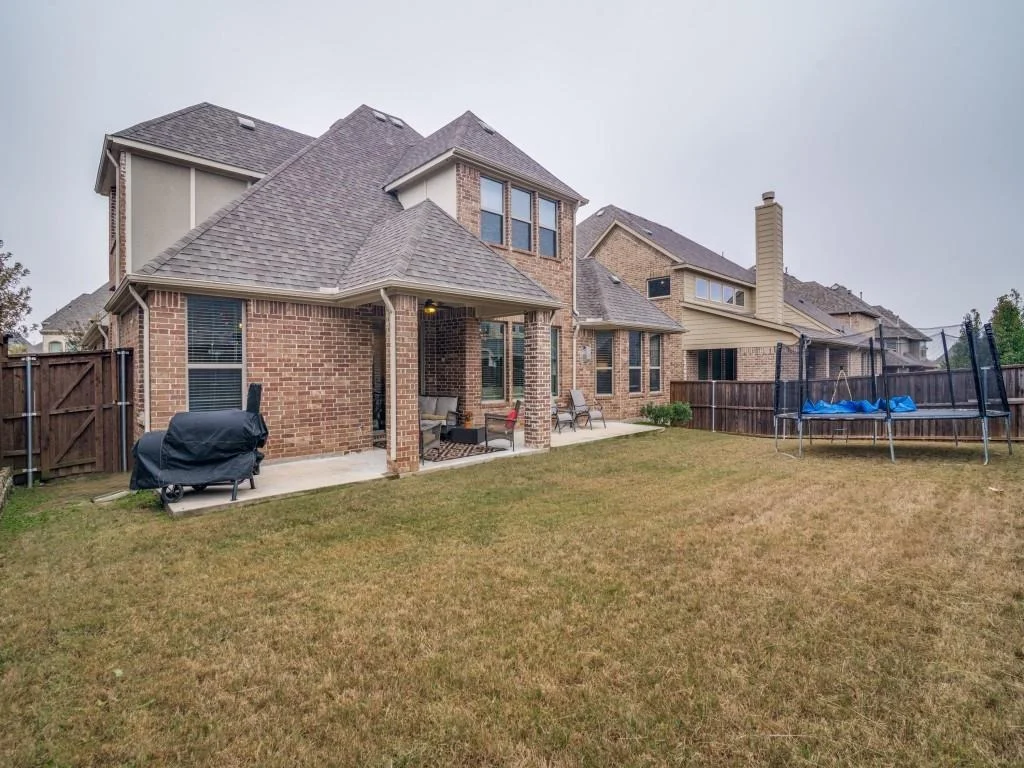
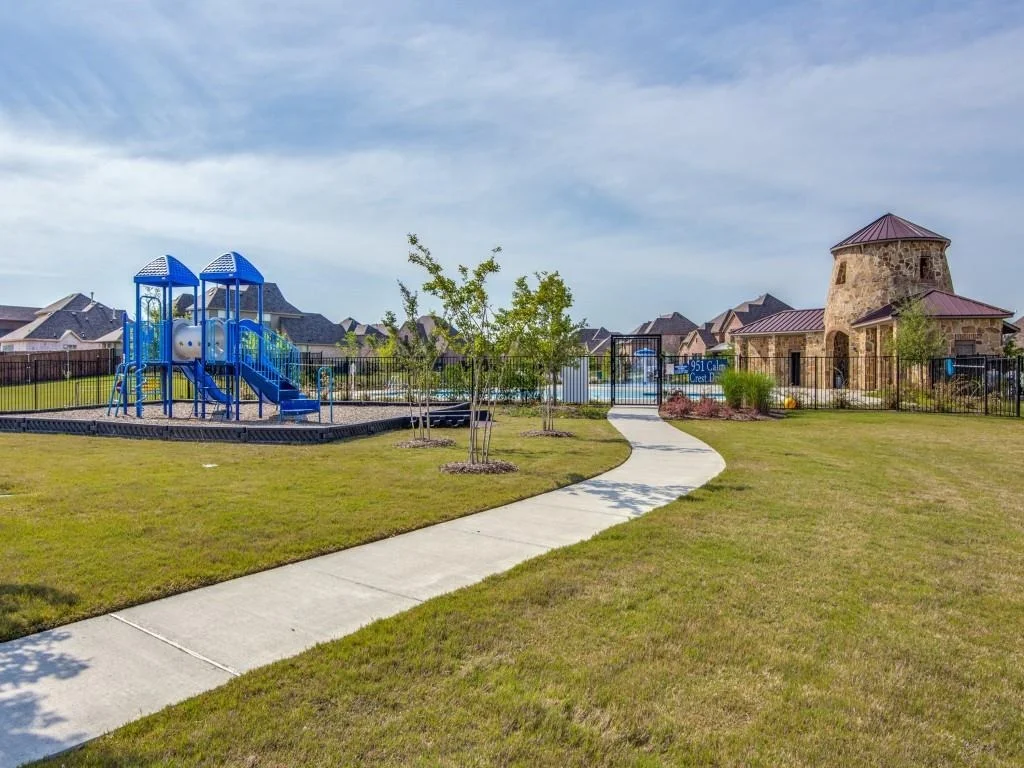
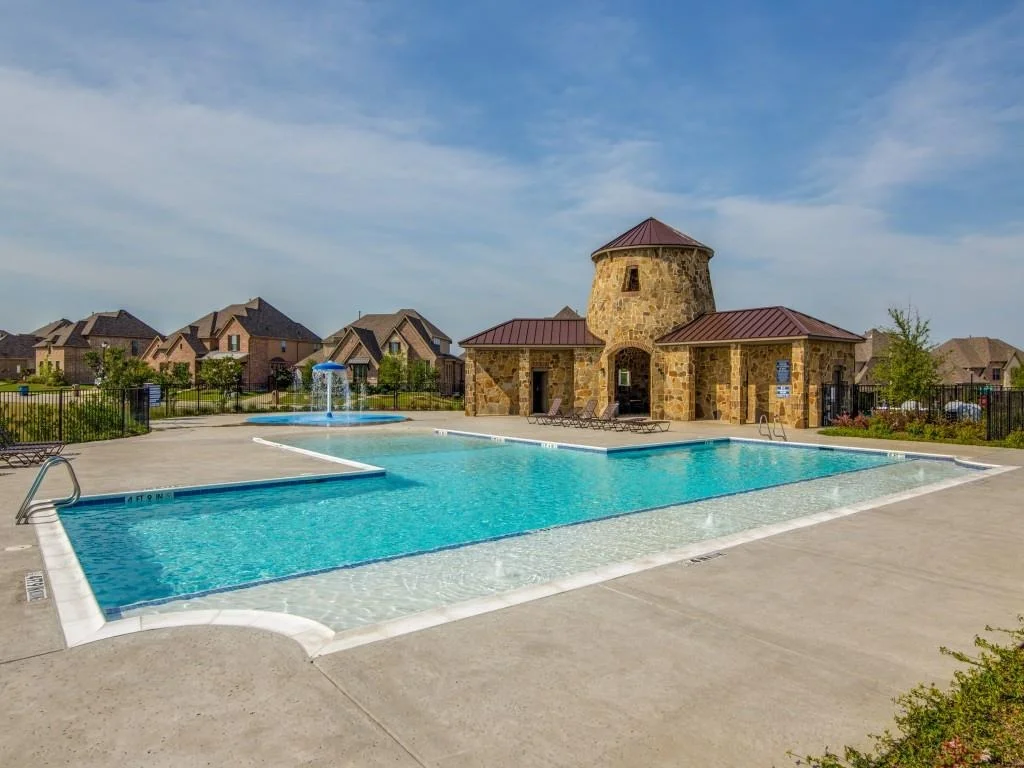
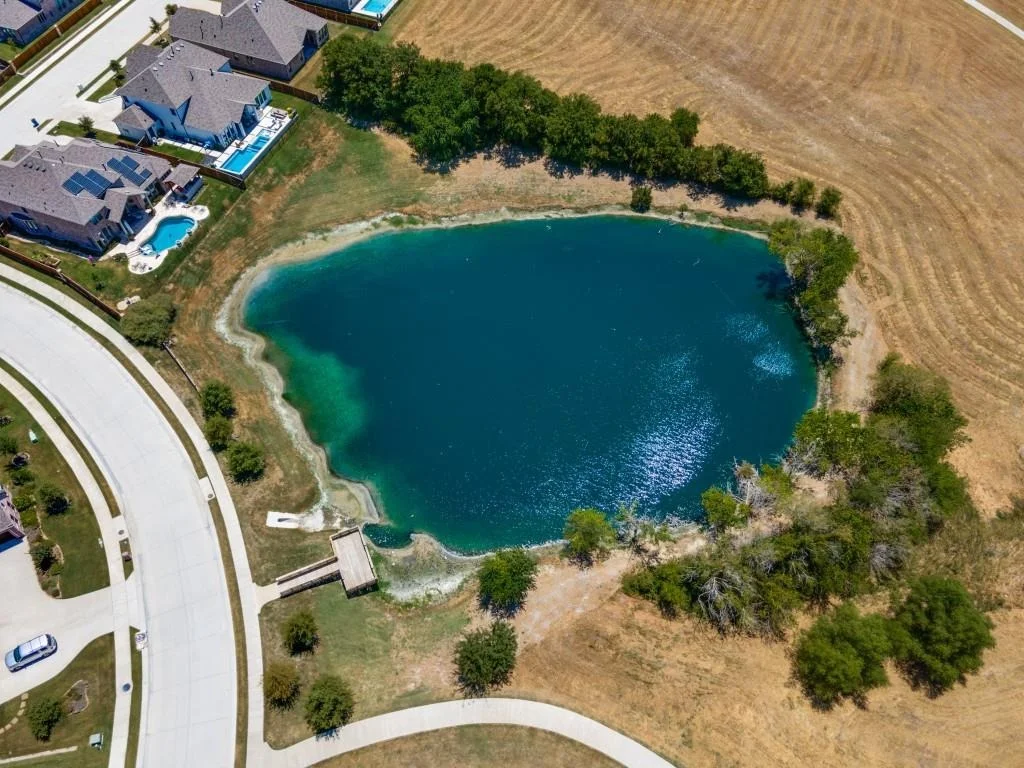
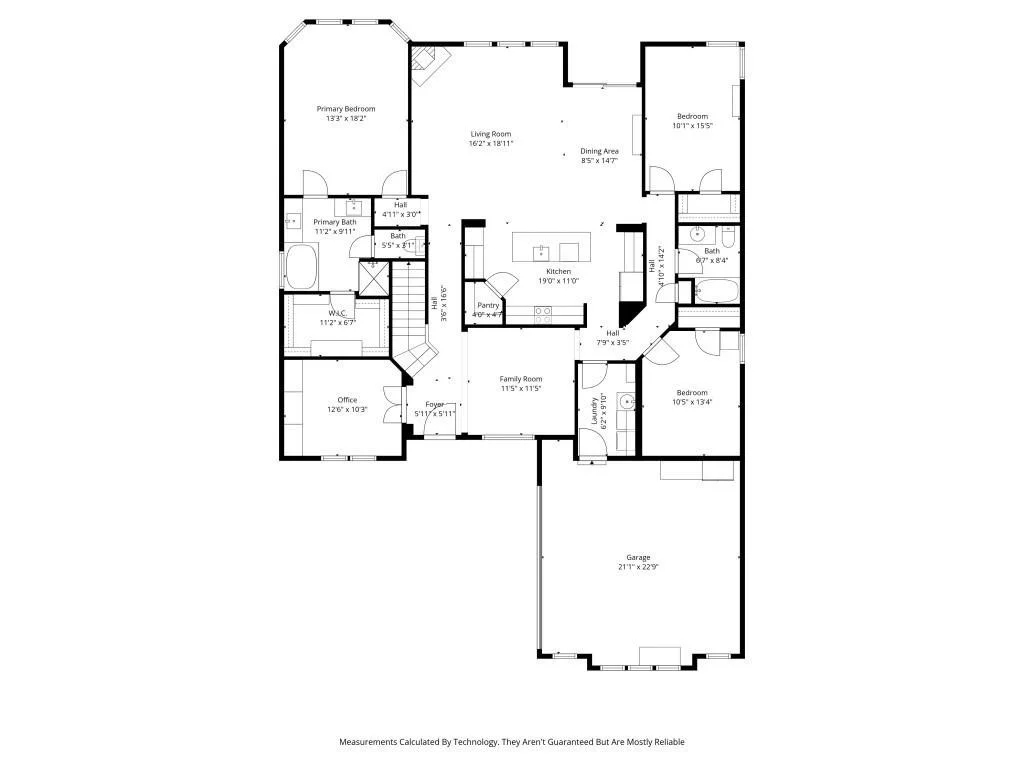
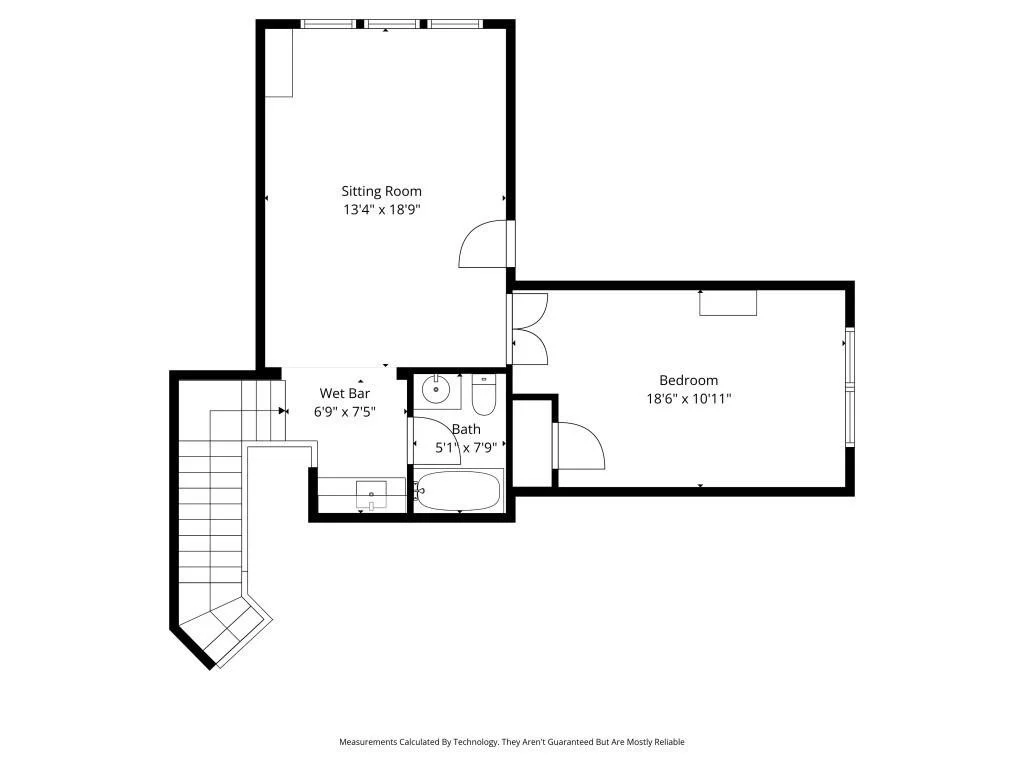
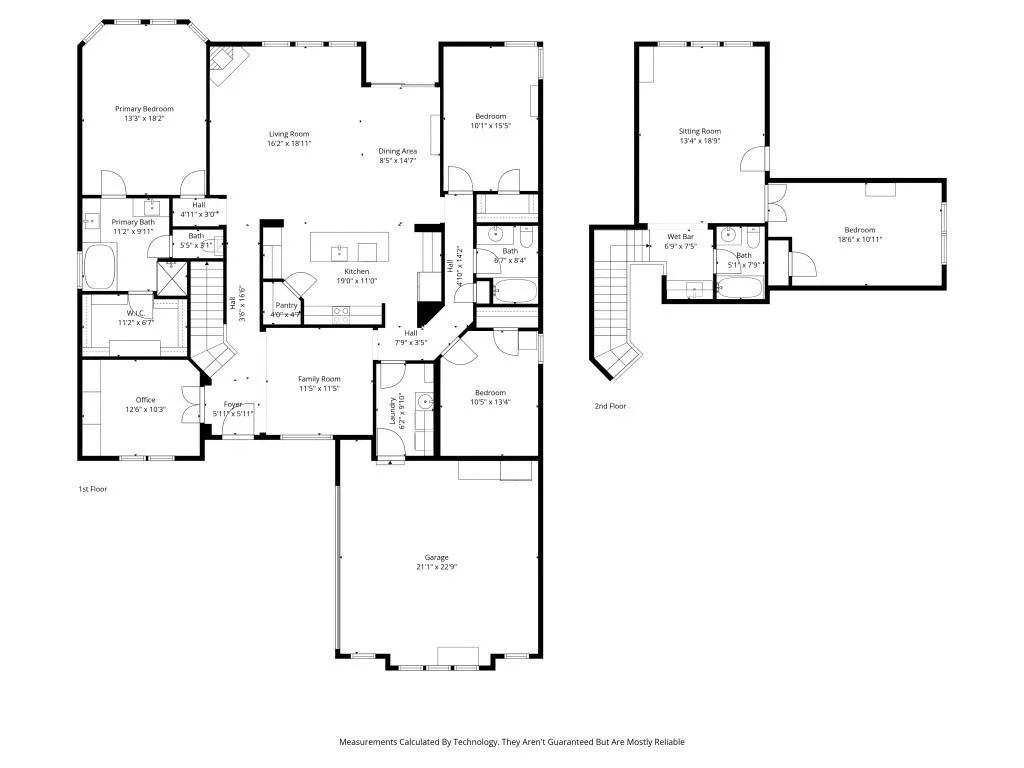
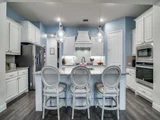
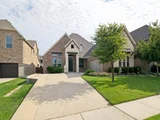
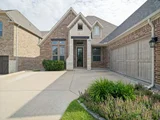
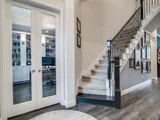
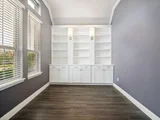
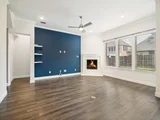
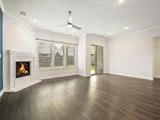
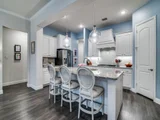
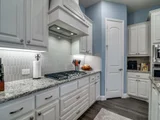
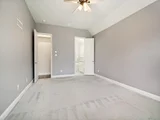
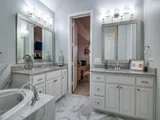
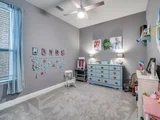
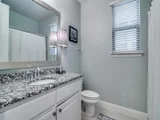
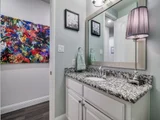
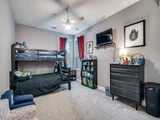
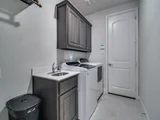
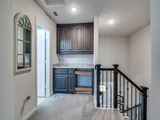
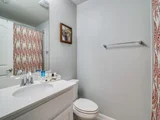
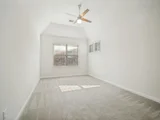
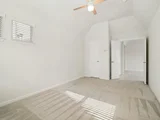
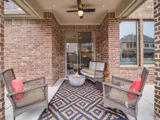
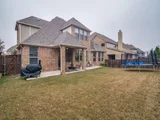
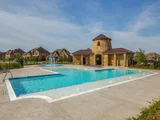
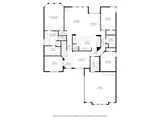
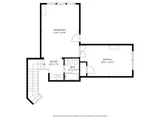
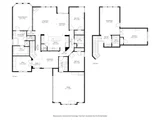
Bring your best offer and let's get this one SOLD! Zoned to highly desirable Rockwall ISD, this 4-bedroom, 3-bath home delivers comfort, versatility, and thoughtful upgrades throughout. Built in 2018, the home features a beautiful stone and brick elevation and a well-designed layout with three bedrooms downstairs and a flexible fourth bedroom upstairs. Inside, enjoy LVP flooring in the main living and dining areas, a welcoming formal living room with crown molding, and a dedicated office with built-in cabinetry and French doors. The kitchen opens to the spacious family room featuring a cozy gas fireplace and offers granite countertops, stainless steel appliances, a gas cooktop, microwave, and a single oven. The private primary suite is set apart from the secondary bedrooms and includes an en-suite bath with granite countertops, dual vanities, a separate shower, a garden tub, and a customized closet system. Upstairs is a game room with a built-in refreshment center and a flex space that can serve as a media room, second office, hobby room or guest suite, complete with an adjacent full bathroom. Additional highlights include a tankless water heater, dedicated laundry room with sink and cabinets for storage, a covered patio with extended concrete, perfect for outdoor living, and a 2 car garage. Residents of Breezy Hill enjoy exceptional community amenities including a pool and splash pad, playground, pavilion, and scenic walking trails.
Payment Calculator
Your Estimated Monthly Payment
Cap Rate Calculator
What does this mean?
Based on our analysis, the cap rate of this property is 1.25%. A negative cap rate indicates that the property might not be feasible as an income-producing asset. The median cap rate for a near zip code 11238 is 4.23%.
How much can I actually make?
Actual monthly rental income may vary between $4,760 and $7,140 depending on unit-specific characteristics. You can change the amount using the slider to further explore.
How is cap rate calculated?
Cap Rate = Net Operating Income (NOI) / Property Asset Value.
When calculating the cap rate, we assume 100% occupancy. Leverage (mortgage) is not considered.
Cap Rate provided by RealtyHop and RentHop, learn more about cap rate here.
Price History
| Date / Event | Date | Event | Price |
|---|---|---|---|
| Oct 8, 2026 | Sold | ||
| Sold | |||
| Sep 15, 2026 | In contract | - | |
| In contract | |||
| Sep 4, 2026 | Price Decreased |
$460,000
↓ $35K
(7.1%) | |
| Price Decreased | |||
| Jul 15, 2026 | Price Decreased |
$495,000
↓ $5K
(1%) | |
| Price Decreased | |||
| May 24, 2026 | Price Decreased |
$499,999
↓ $34K
(6.4%) | |
| Price Decreased | |||

Property Highlights
Building Info
Comparables
Status
Price/ft²
Listed On
Sold On
About Rockwall
Similar Homes for Sale
Currently no similar homes aroundNearby Rentals

Last Updated: 2 months ago
Data Source: NTREIS MLS, MLS# 21124262
Details provided by NTREIS and may not match the public record











 Your Privacy Choices
Phone: 425-283-2930
Address: 335 Madison Avenue, New York, NY 10017