


1 /
7
Map
$199,000 Last Listed Price
●
House -
Off Market
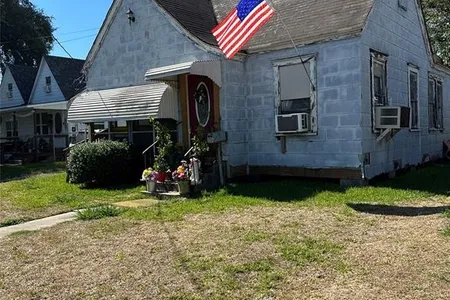
517 N Sidney Street
Houston, TX 77003
4 Beds
2 Baths
930 Sqft
$1,440
Estimated Monthly
$0
HOA / Fees
13.49%
Cap Rate
Unit Size
930Ft²
Days on Market
144 days
Land Size
0.11 acres
Price per sqft
$214
Property Type
House
Property Taxes
$462
HOA Dues
-
Year Built
1930
Last updated: 2 months ago (HAR #56948980)
Price History
| Date / Event | Date | Event | Price |
|---|---|---|---|
| Mar 11, 2024 | Sold | $176,000 - $214,000 | |
| Sold | |||
| Feb 13, 2024 | In contract | - | |
| In contract | |||
| Oct 19, 2023 | Listed by Coldwell Banker Universal | $199,000 | |
| Listed by Coldwell Banker Universal | |||
Property Highlights
Building Info
Overview
Building
Neighborhood
Geography

517 N Sidney Street
By proceeding, you consent to receive calls and texts at the number you provided, including marketing by autodialer and prerecorded and artificial voice, and email, from Move, Inc., Move Sales, Inc., Opcity, Inc., realtor.com, and their network of service providers, about your inquiry and other home-related matters, but not as a condition of any purchase. Msg/data rates may apply. This consent applies even if you are on a corporate, state, or national Do Not Call list.
By proceeding, you agree to our Terms of Service.
Comparables
Unit
Status
Status
Type
Beds
Baths
ft²
Price/ft²
Price/ft²
Asking Price
Listed On
Listed On
Closing Price
Sold On
Sold On
HOA + Taxes
House
3
Beds
1
Bath
1,186 ft²
$222,000
Nov 2, 2023
$200,000 - $244,000
Dec 6, 2023
-
House
4
Beds
2
Baths
1,808 ft²
$175,000
Dec 28, 2019
$158,000 - $192,000
May 22, 2020
$246/mo
Sold
House
2
Beds
1
Bath
964 ft²
$203,990
Apr 25, 2019
$183,000 - $223,000
May 31, 2019
$359/mo
House
2
Beds
1
Bath
949 ft²
$200,000
Jul 1, 2021
$180,000 - $220,000
Sep 30, 2021
$346/mo
Sold
House
2
Beds
1
Bath
816 ft²
$172,000
Nov 22, 2020
$155,000 - $189,000
Apr 20, 2021
$197/mo
House
2
Beds
1
Bath
983 ft²
$210,000
Dec 31, 2020
$189,000 - $231,000
Apr 8, 2021
$214/mo
In Contract
House
3
Beds
1
Bath
1,050 ft²
$171/ft²
$180,000
Nov 9, 2023
-
$265/mo
In Contract
House
3
Beds
2
Baths
1,603 ft²
$122/ft²
$195,000
Feb 22, 2024
-
$303/mo
Active
Multifamily
2
Beds
1
Bath
1,440 ft²
$146/ft²
$210,000
Jan 15, 2024
-
$168/mo
About South Central Houston
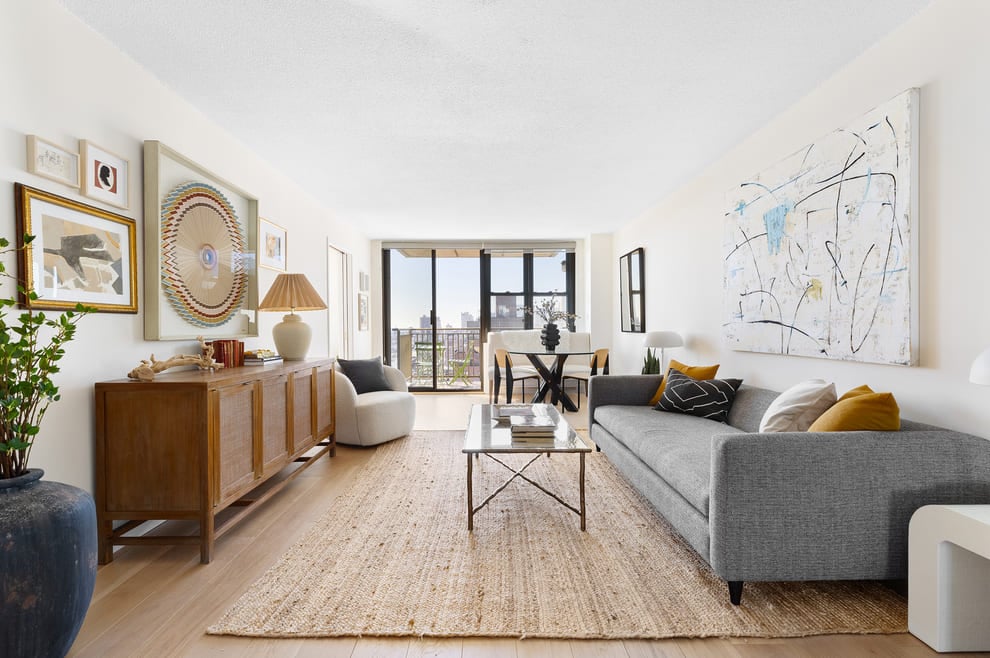
Similar Homes for Sale


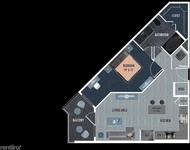
Nearby Rentals

$1,619 /mo
- 1 Bed
- 1 Bath
- 862 ft²
$1,668 /mo
- 1 Bed
- 1 Bath
- 689 ft²

Listed by: Blanca Ruiz Garza, Coldwell Banker Universal
Last Updated: 2 months ago
Data Source: HAR , MLS# 56948980
Copyright © 2024, Houston Realtors Information Service, Inc. Information provided is exclusively for consumers’ personal, non-commercial use and may not be used for any
purpose other than to identify prospective properties consumers may be interested in purchasing. All information provided is deemed reliable but is not guaranteed and should be independently verified.
Last Updated: 2 months ago
Data Source: HAR , MLS# 56948980
Courtesy of RH Advisors, Inc. and RHP Realty NJ, Inc.