


41
Map
2320 W 67th Dr


About This Property
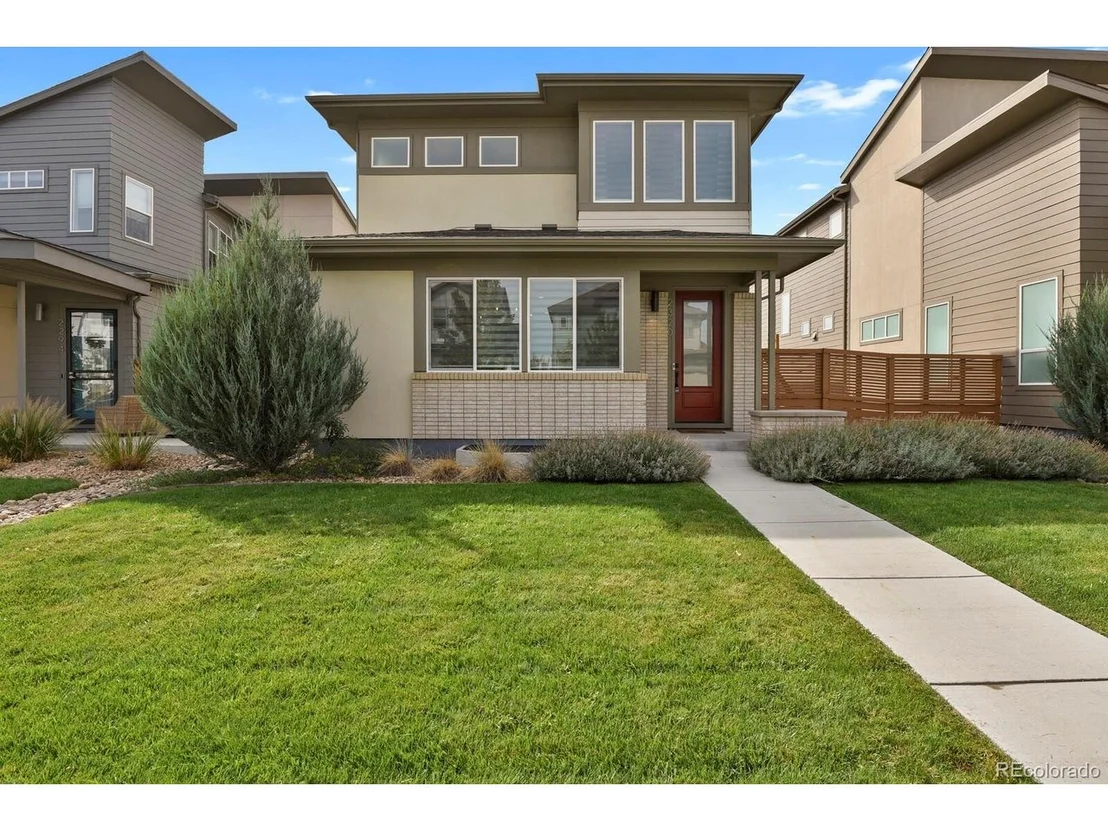
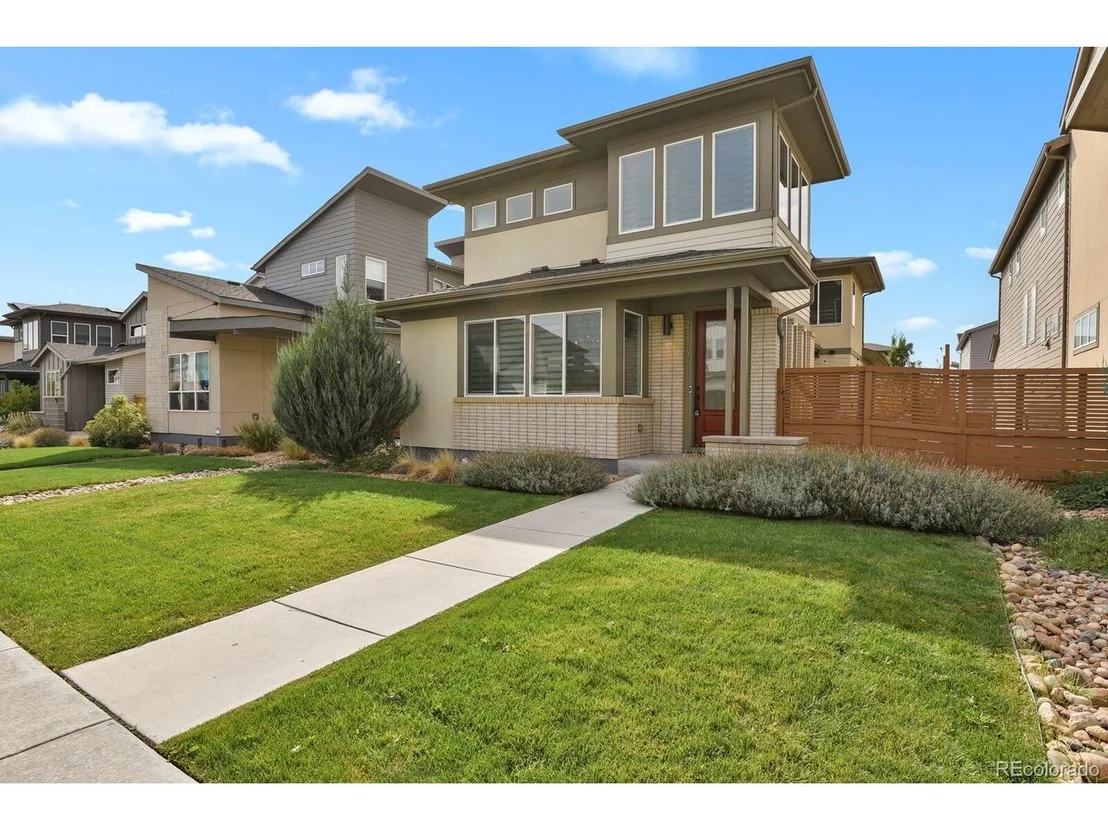
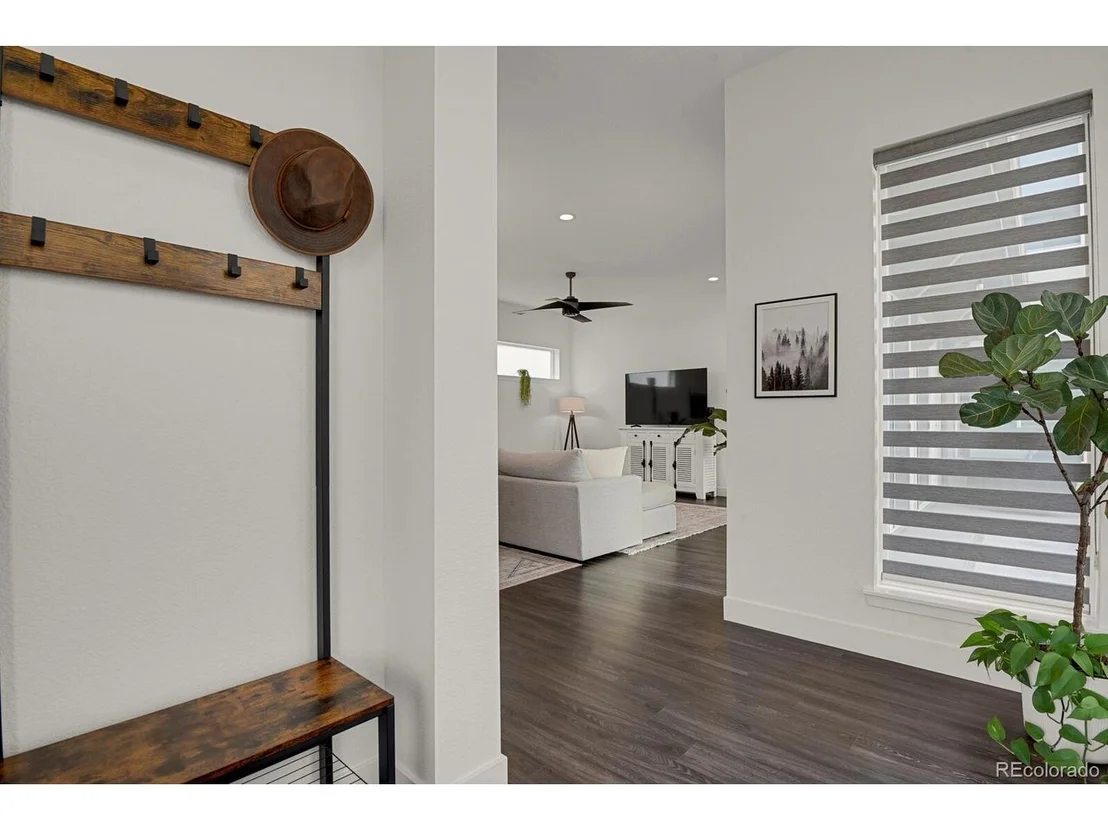
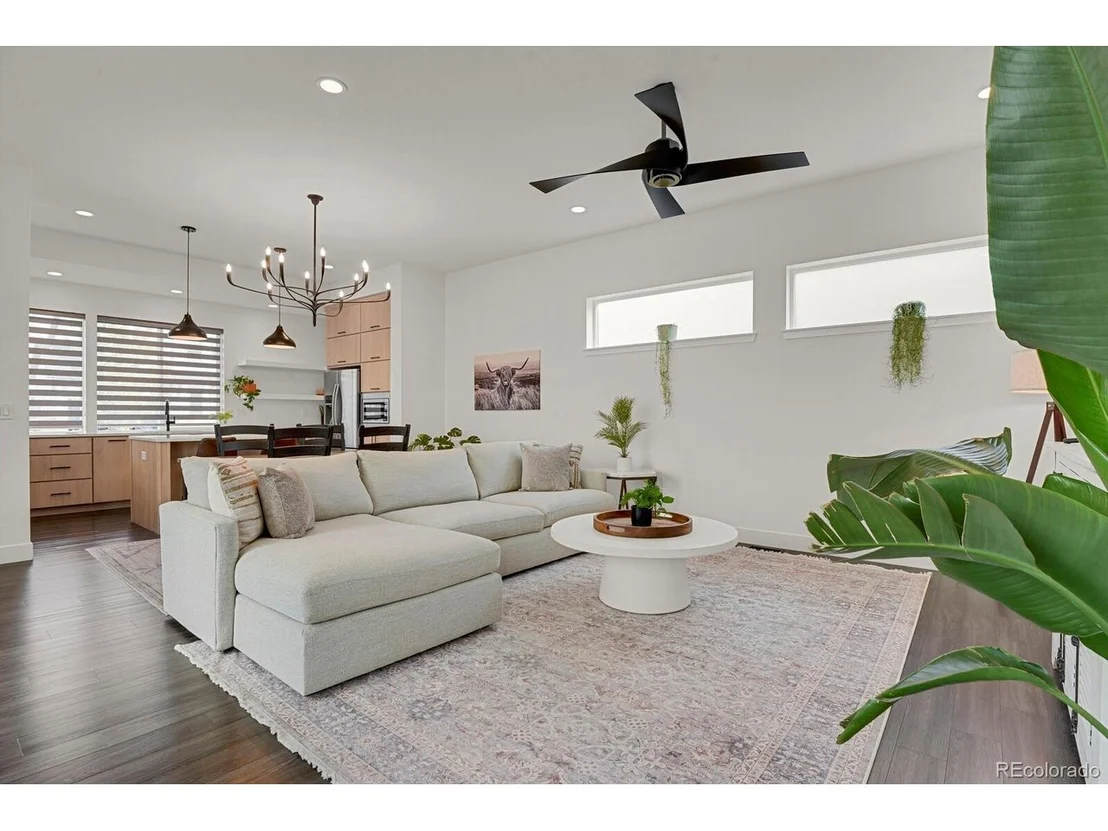
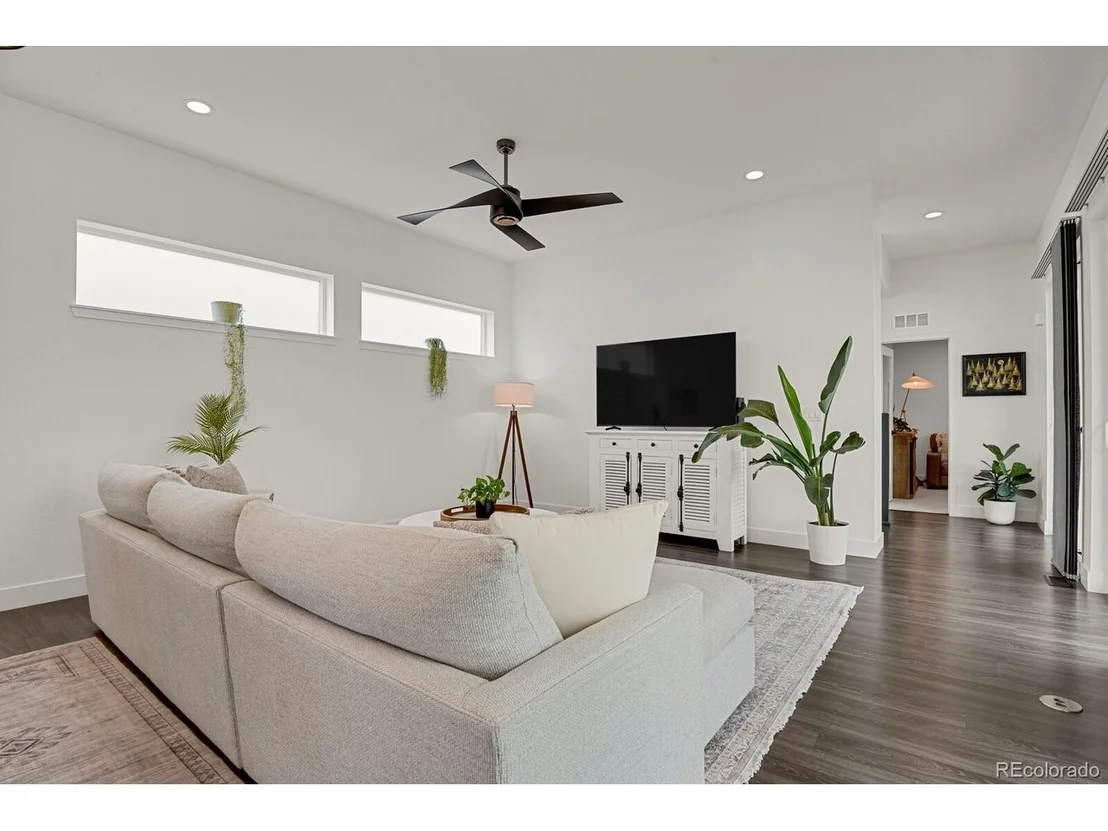
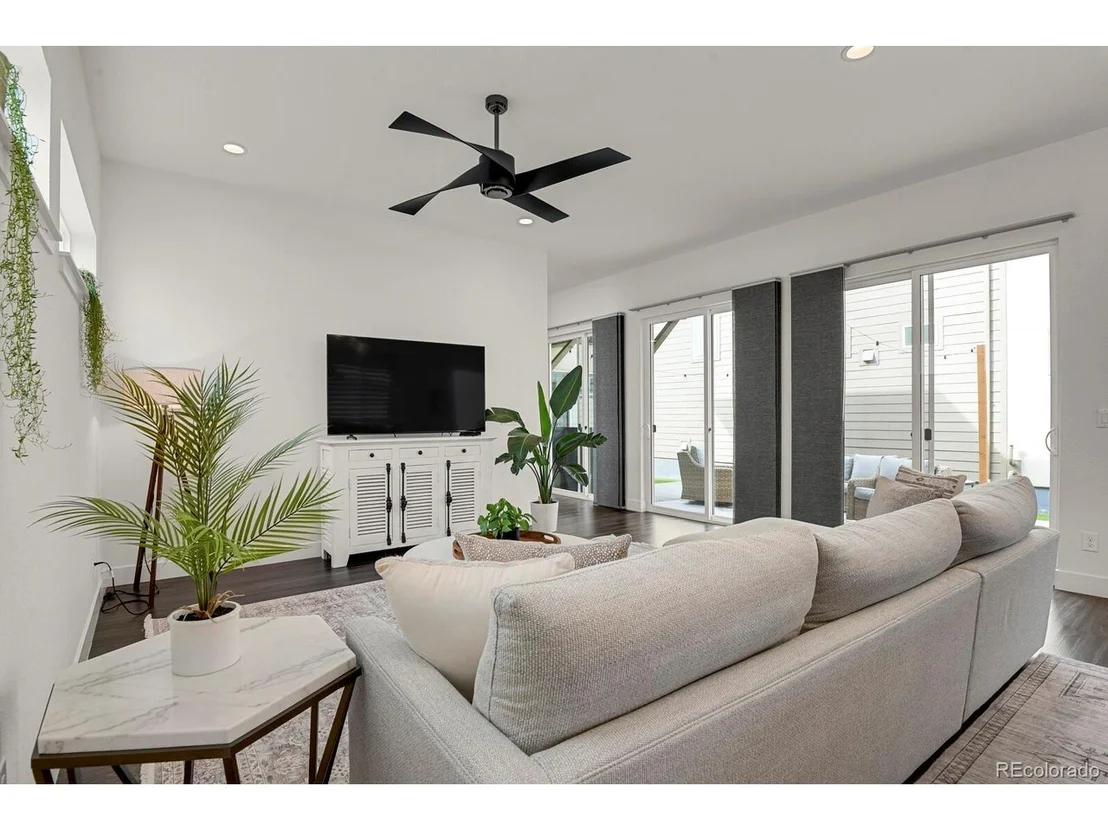
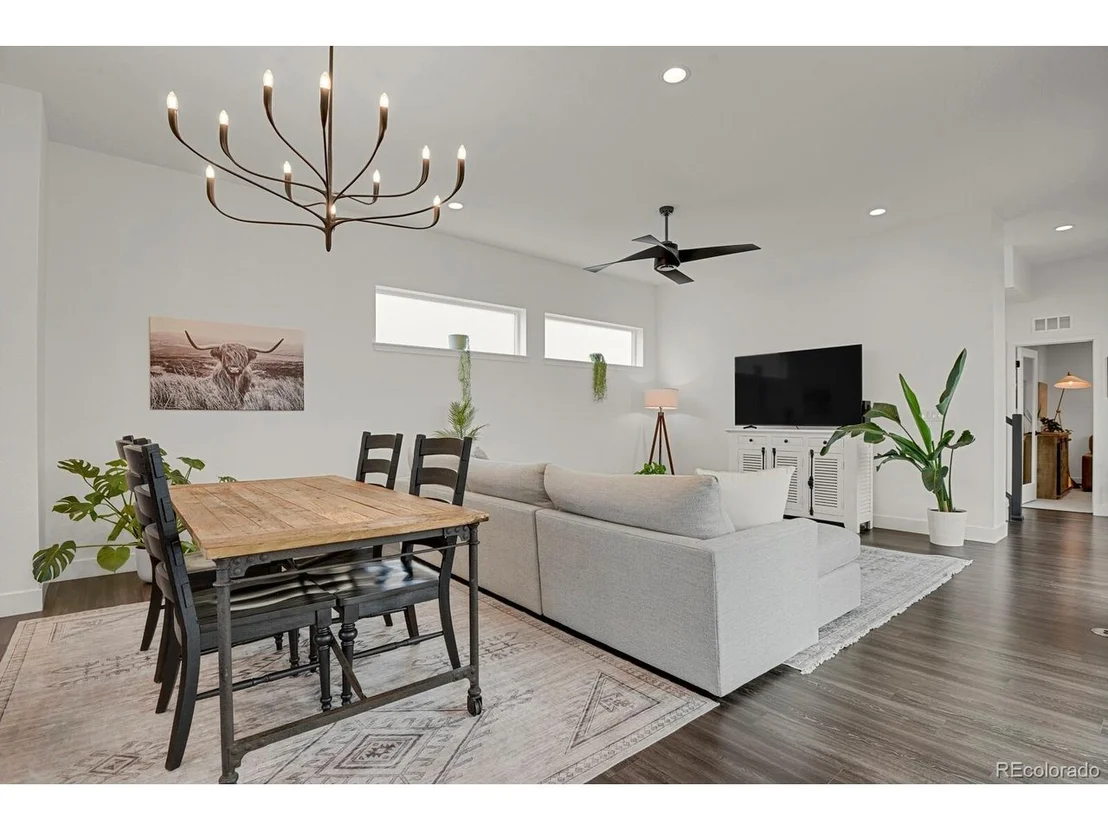
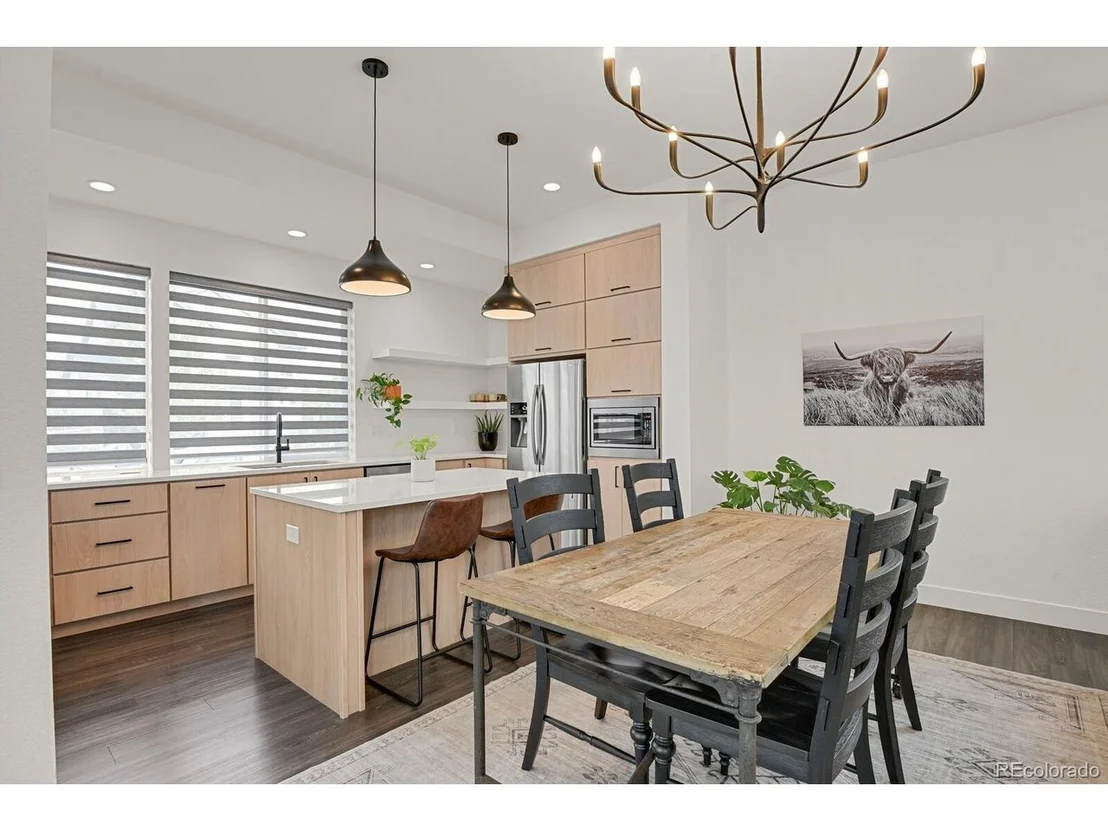
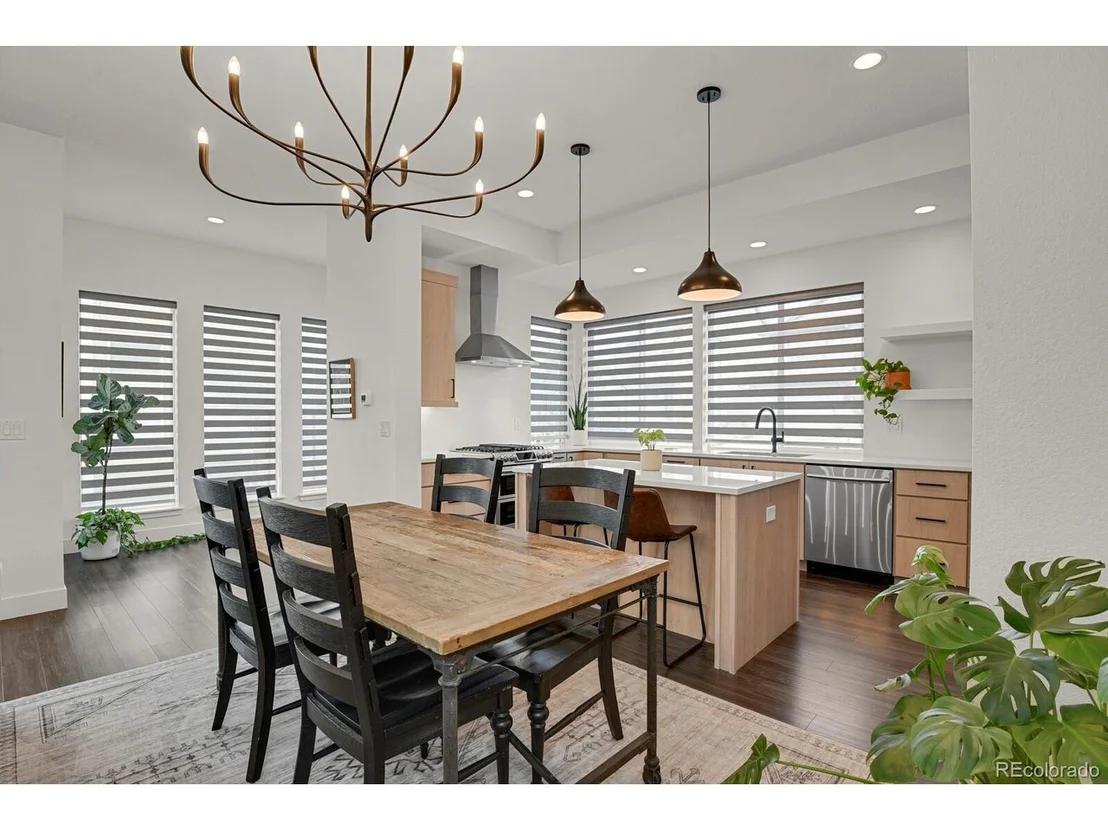
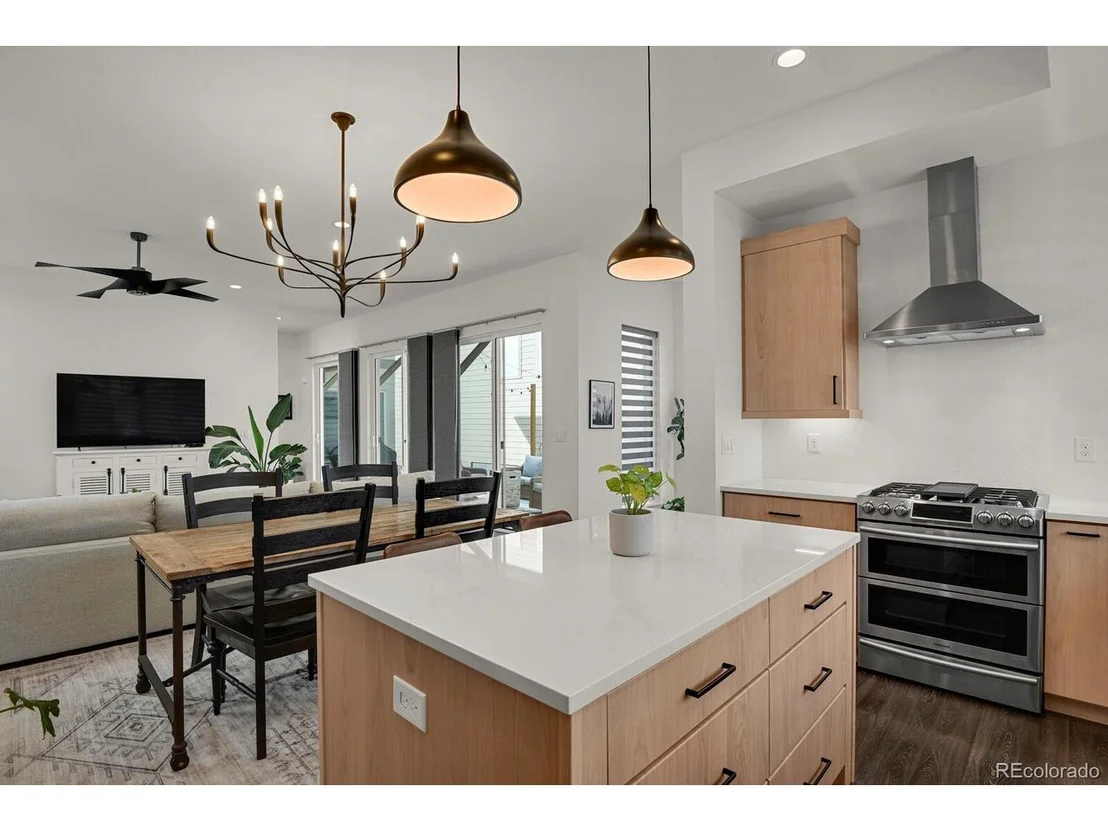
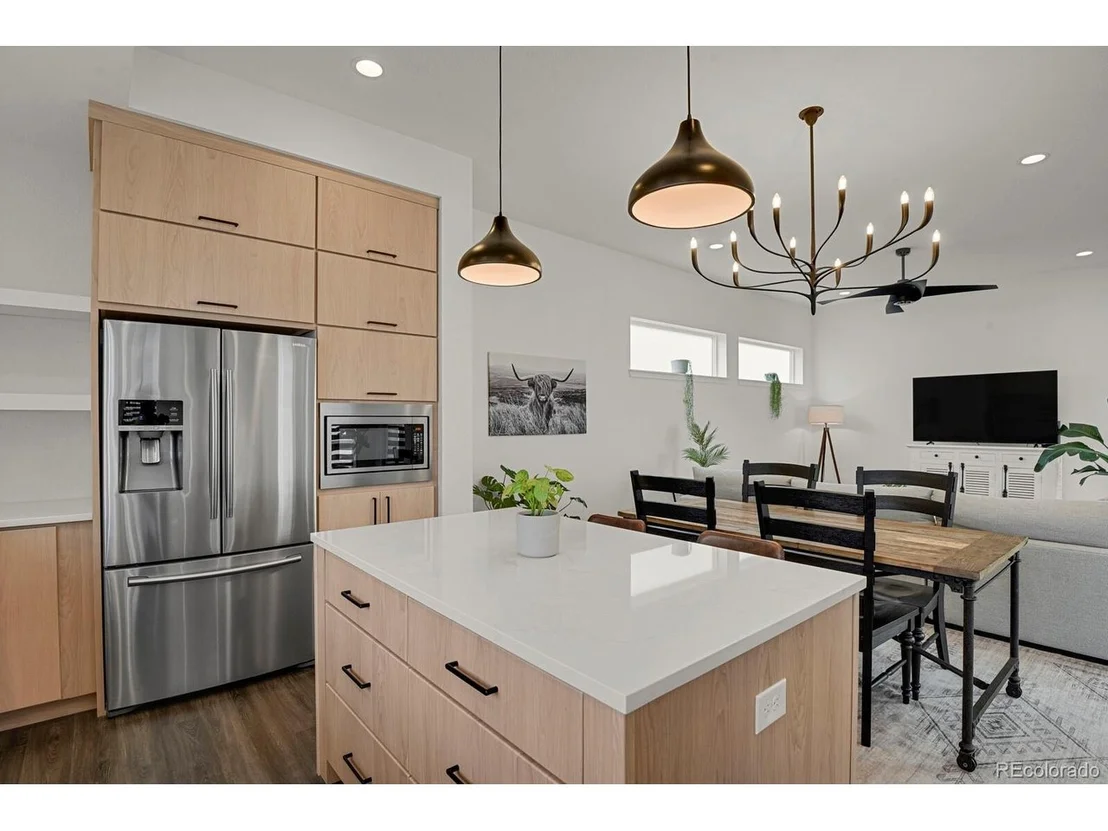
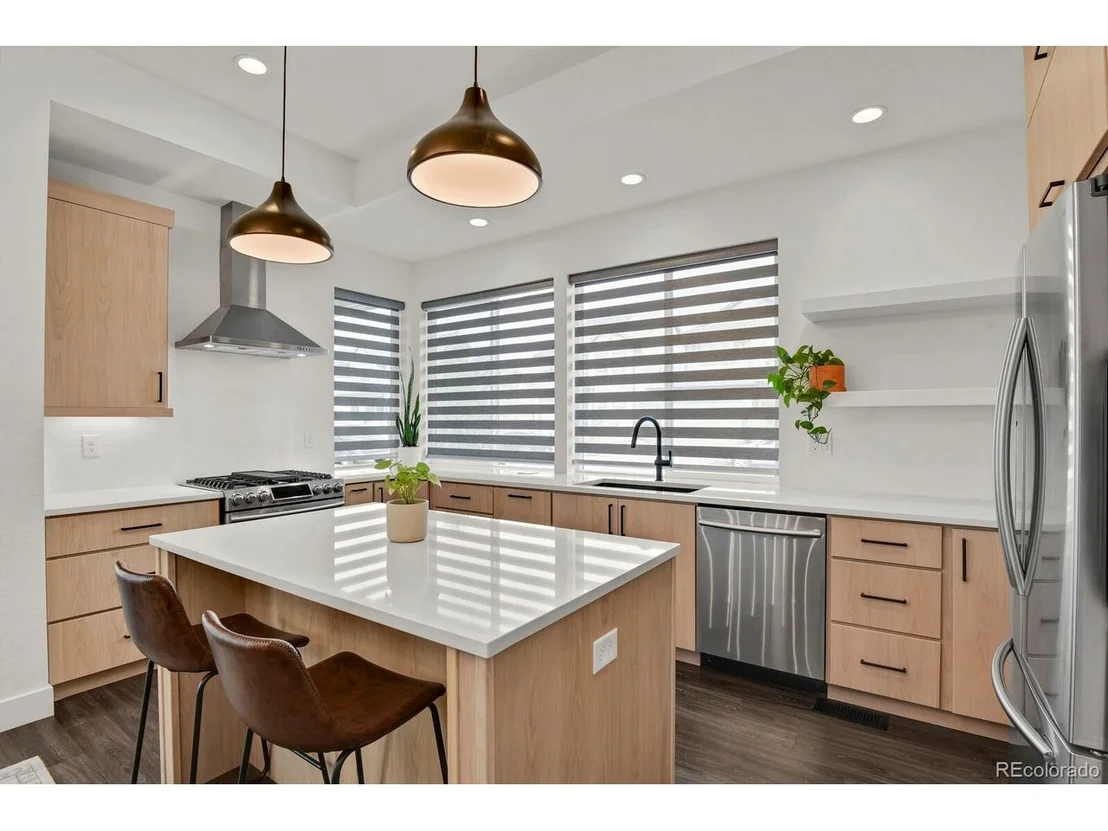
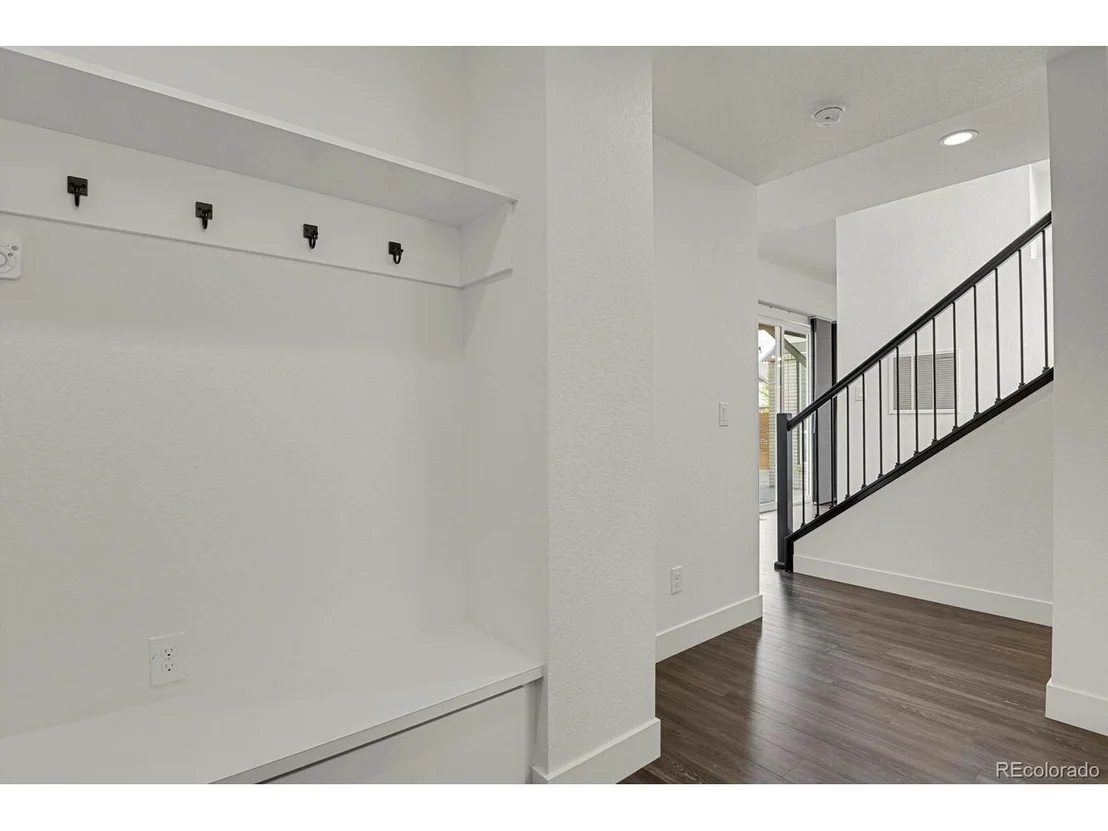
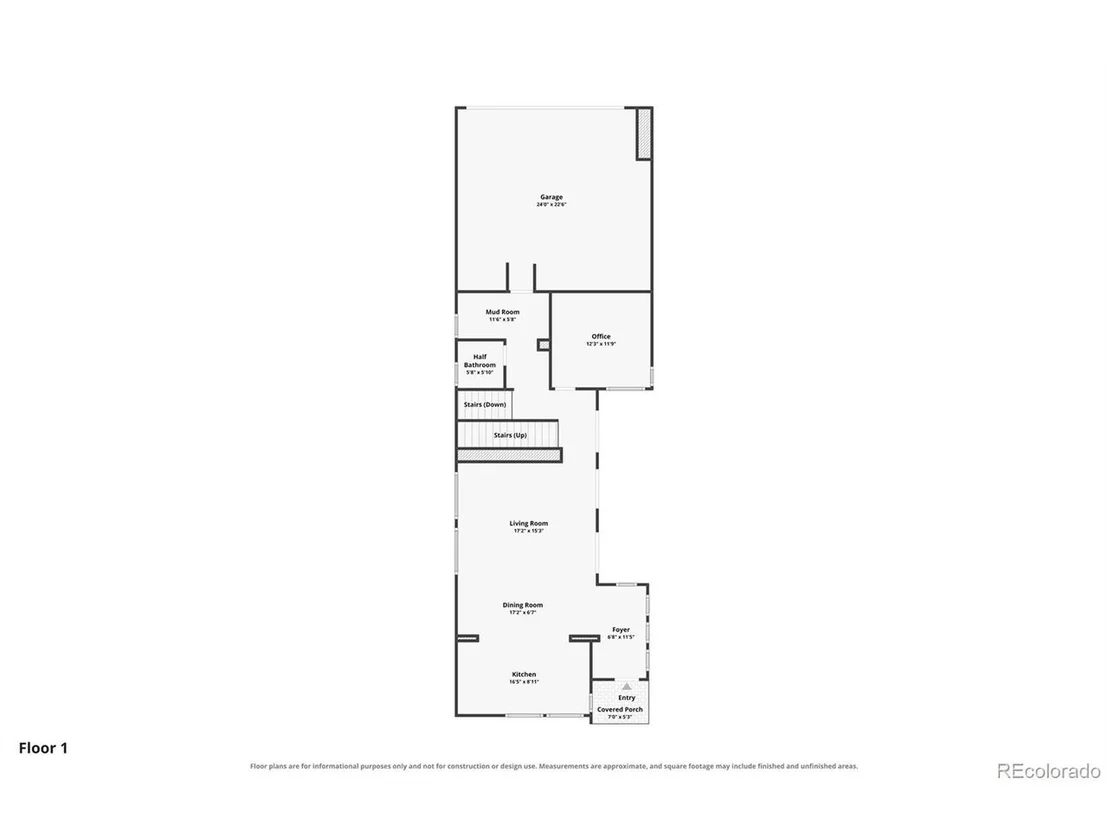
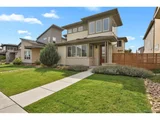
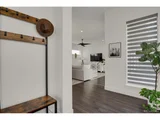
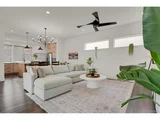
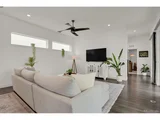
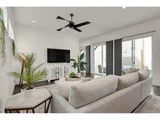
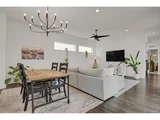
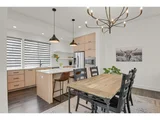
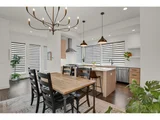
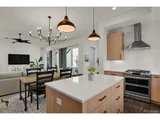
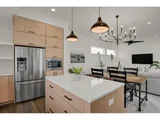
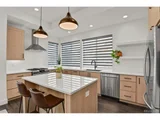
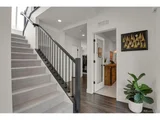
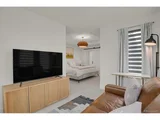
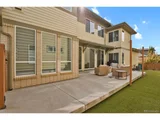
The open main level is made for gathering, with spacious living and dining areas flowing into an updated kitchen featuring new quartz countertops, stainless steel appliances, new cabinetry, and a large center island. Two sets of sliding doors open to a lighted patio and professionally landscaped side yard with low-maintenance turf, creating an inviting space for morning coffee, outdoor dinners, or relaxing at the end of the day.
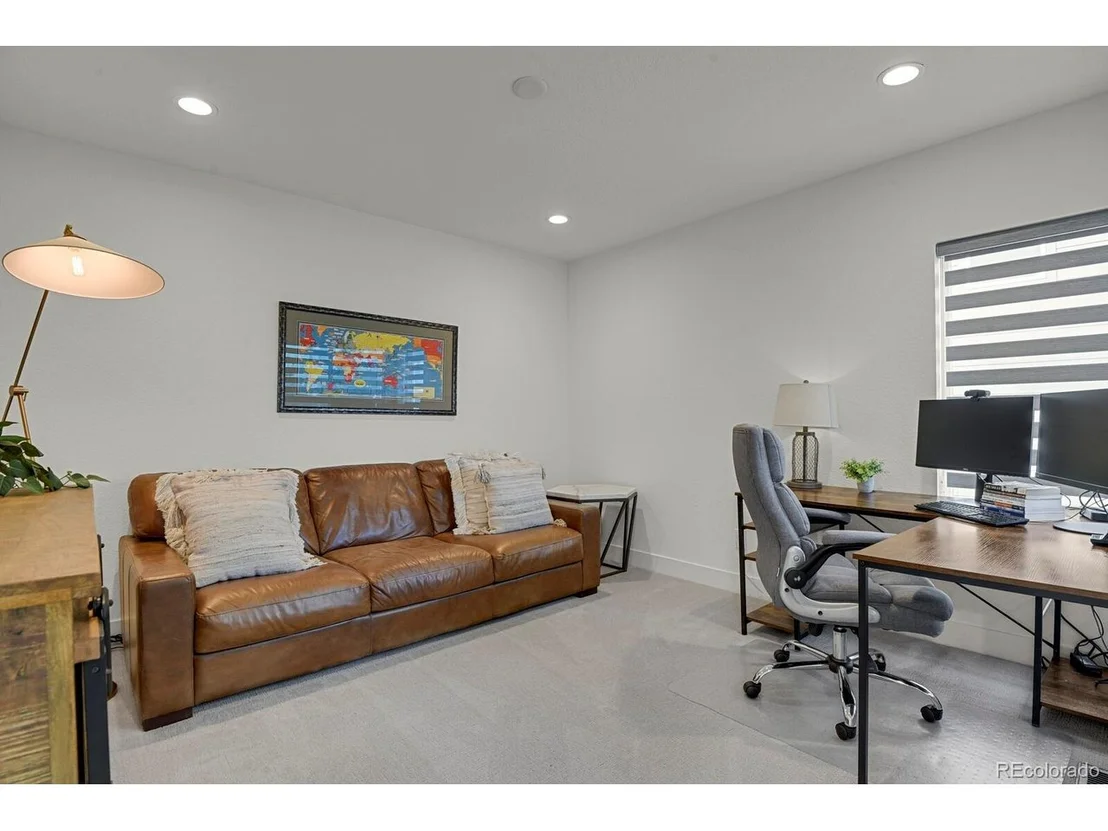
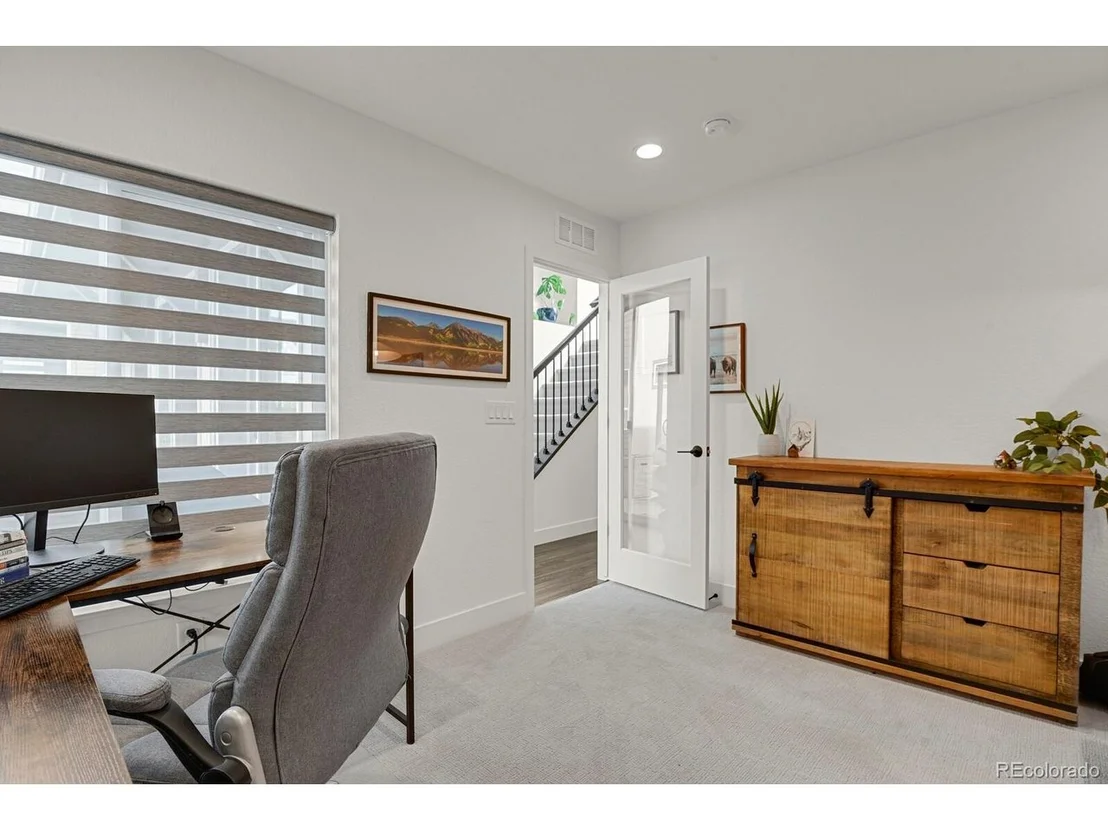
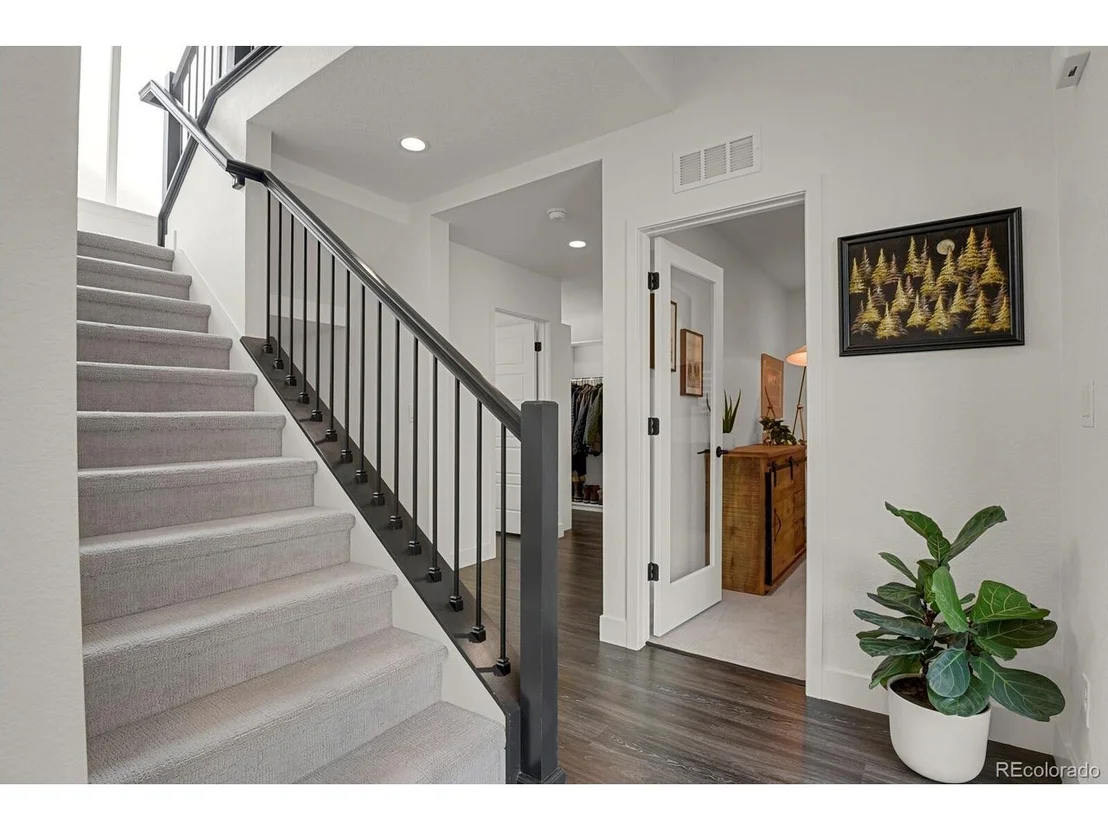
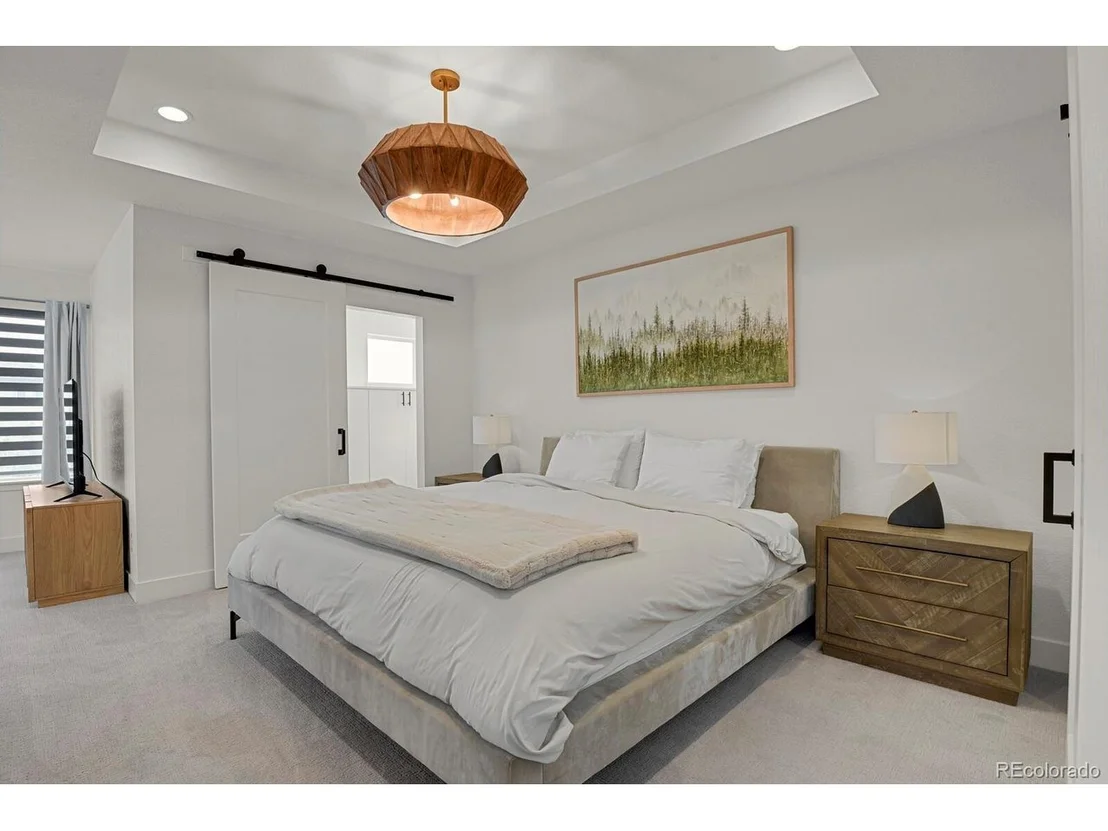
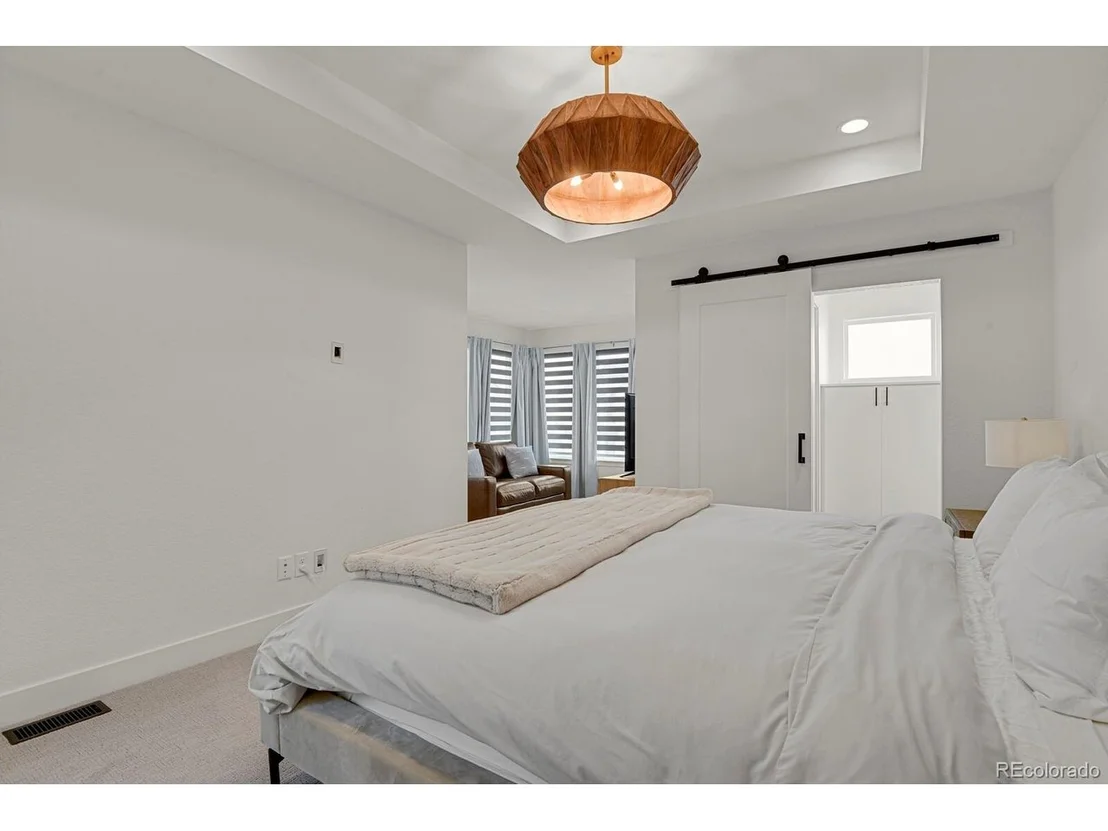
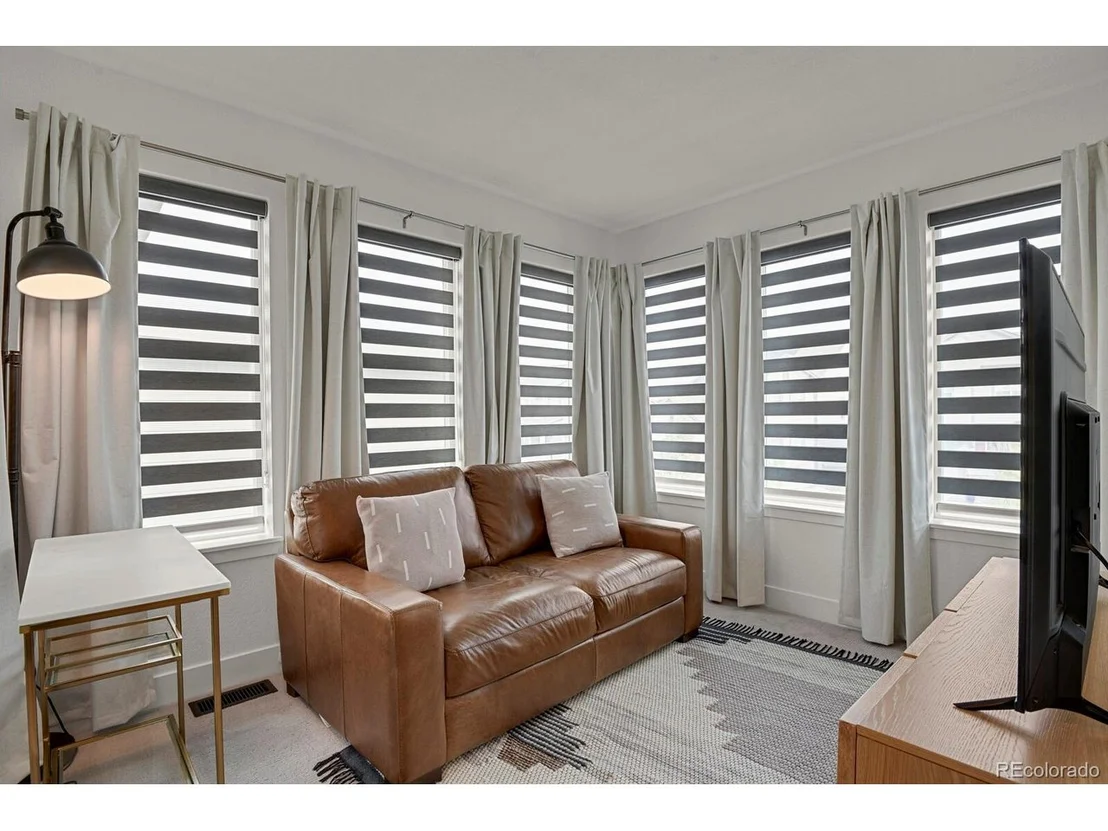
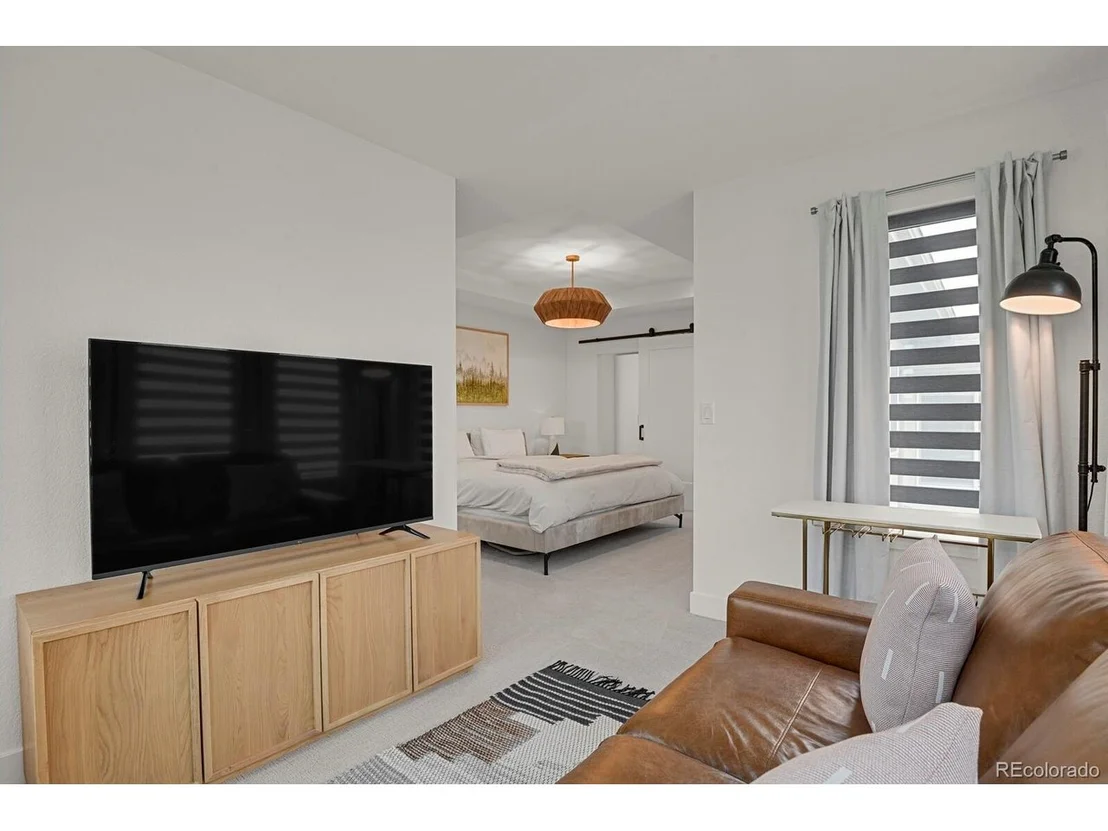
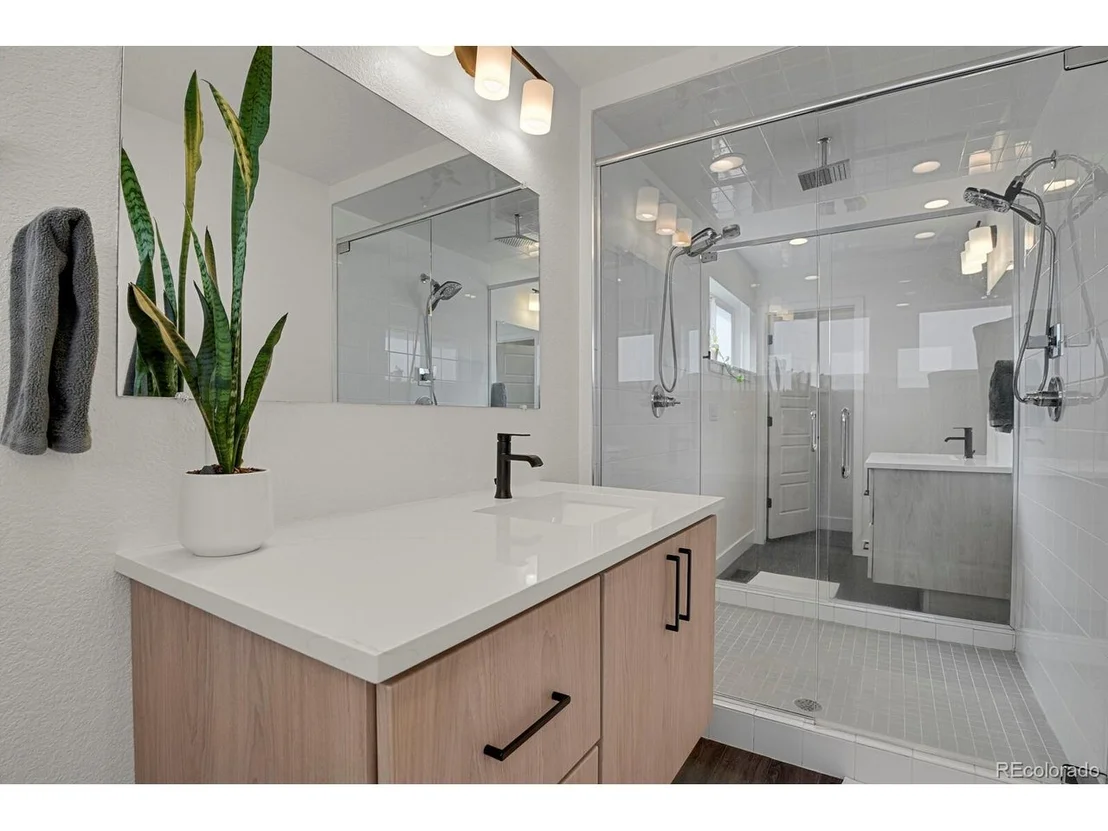
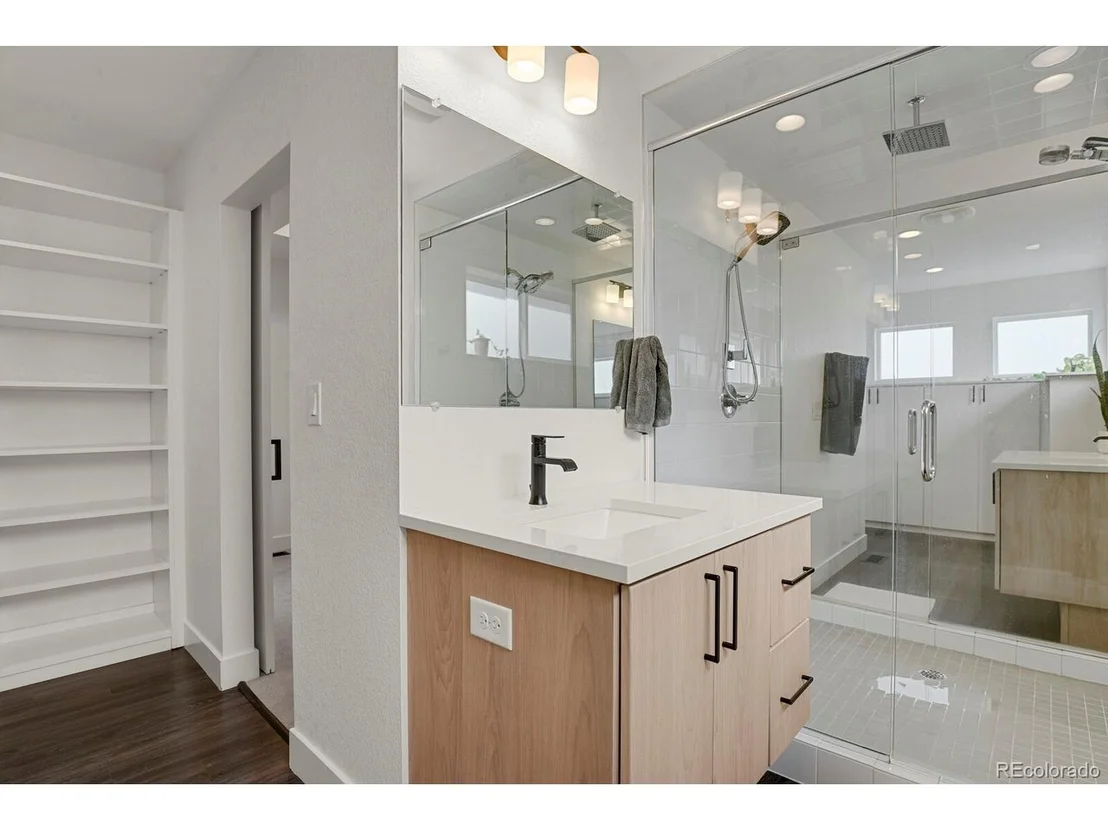
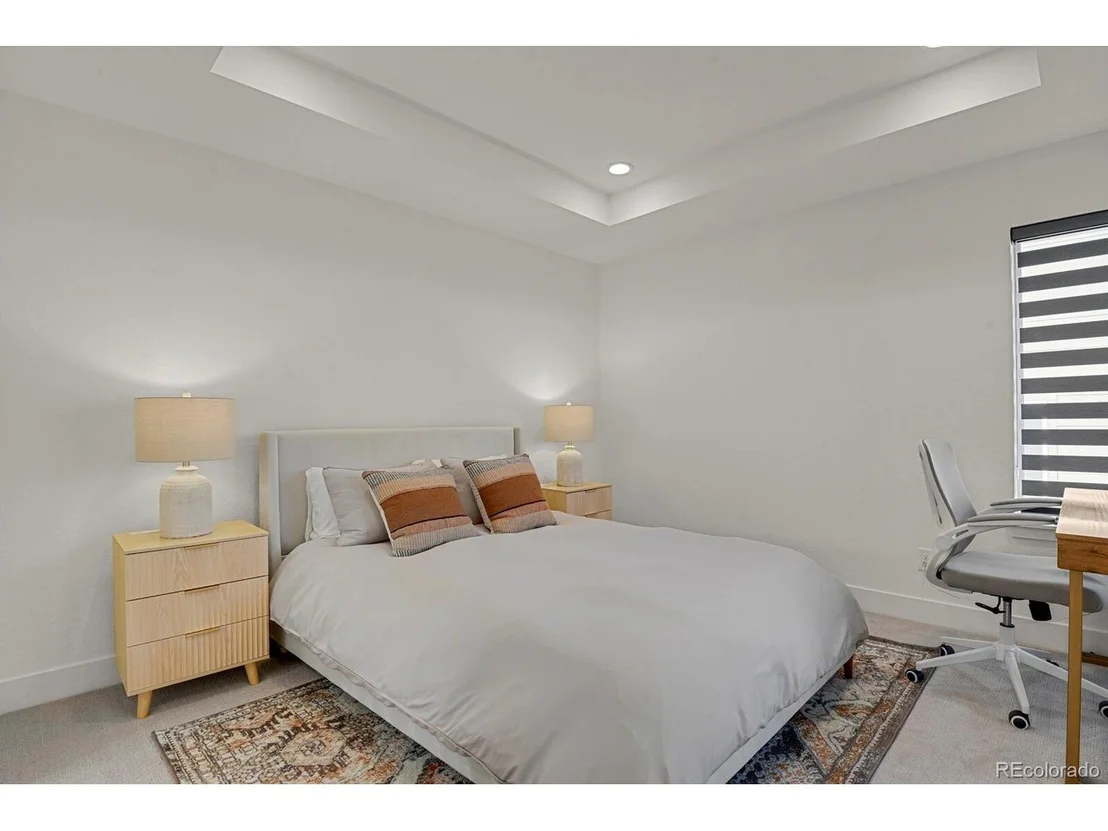
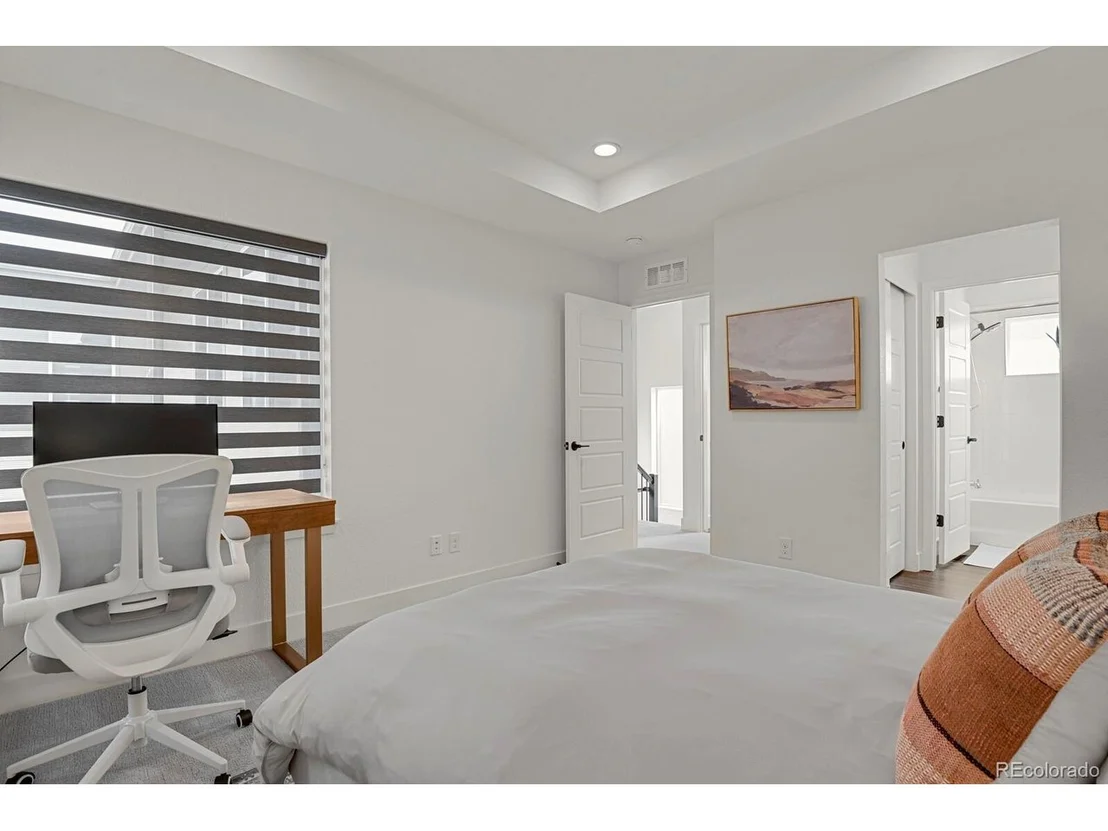
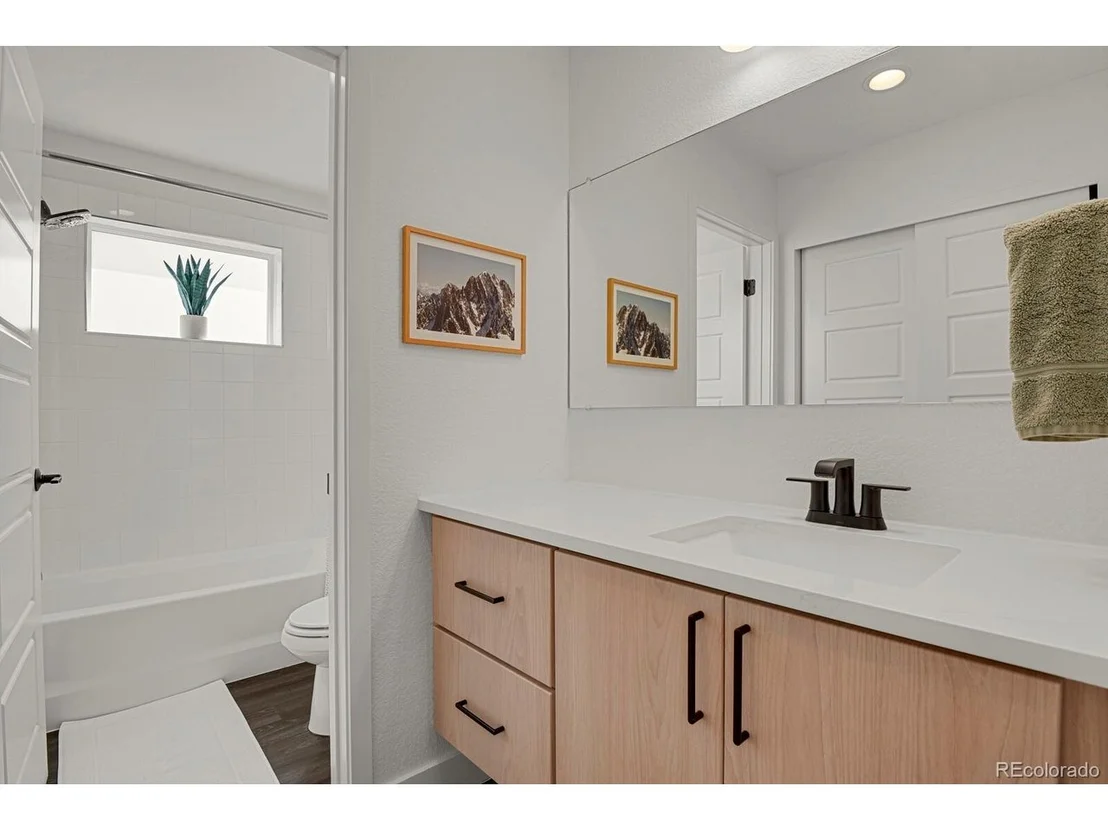
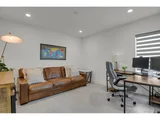
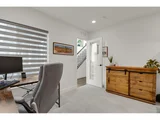
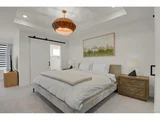
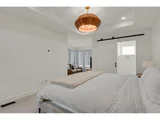
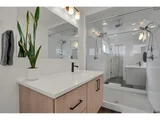
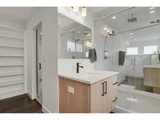
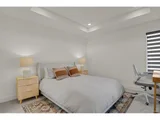
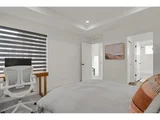
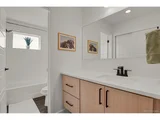
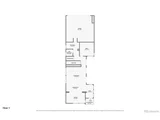
Upstairs, the spacious primary suite has a bathroom unlike most. Two separate vanity and toilet areas share an oversized walk-in shower, with a walk-in closet on each side. The second bedroom has its own ensuite full bathroom, while the main-level flex room offers the flexibility of an office, den, or additional bedroom.
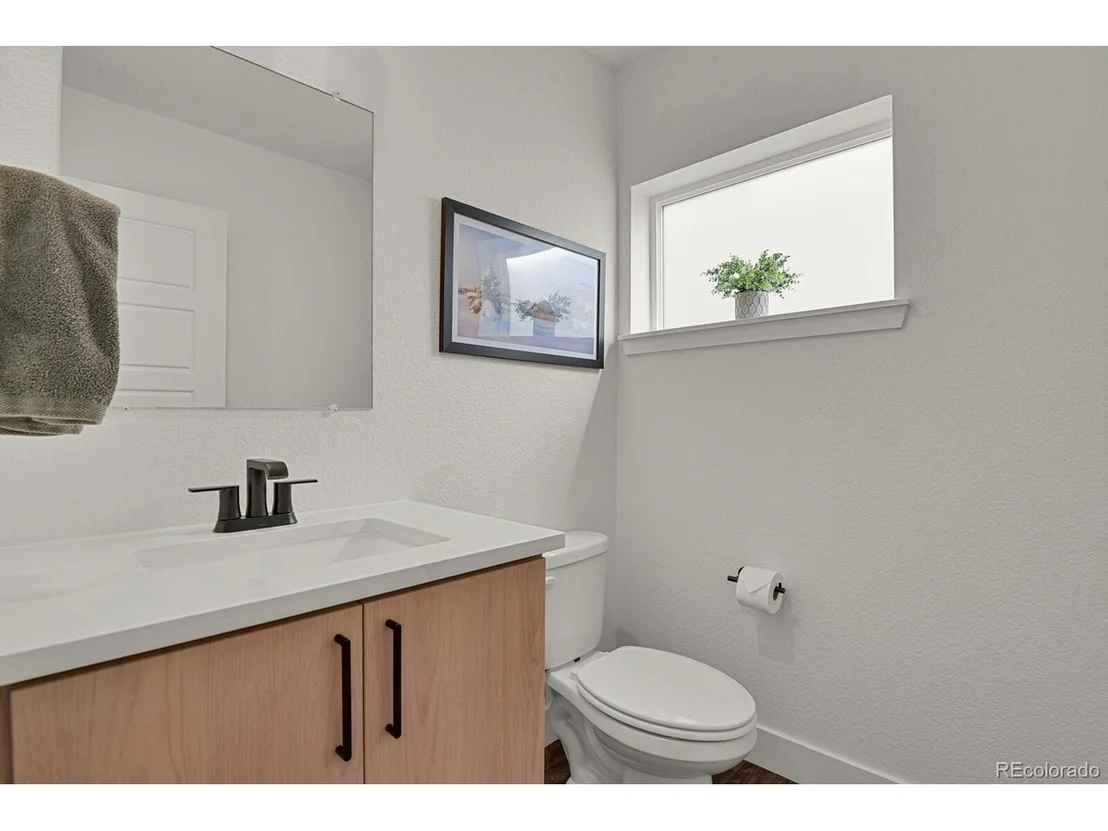
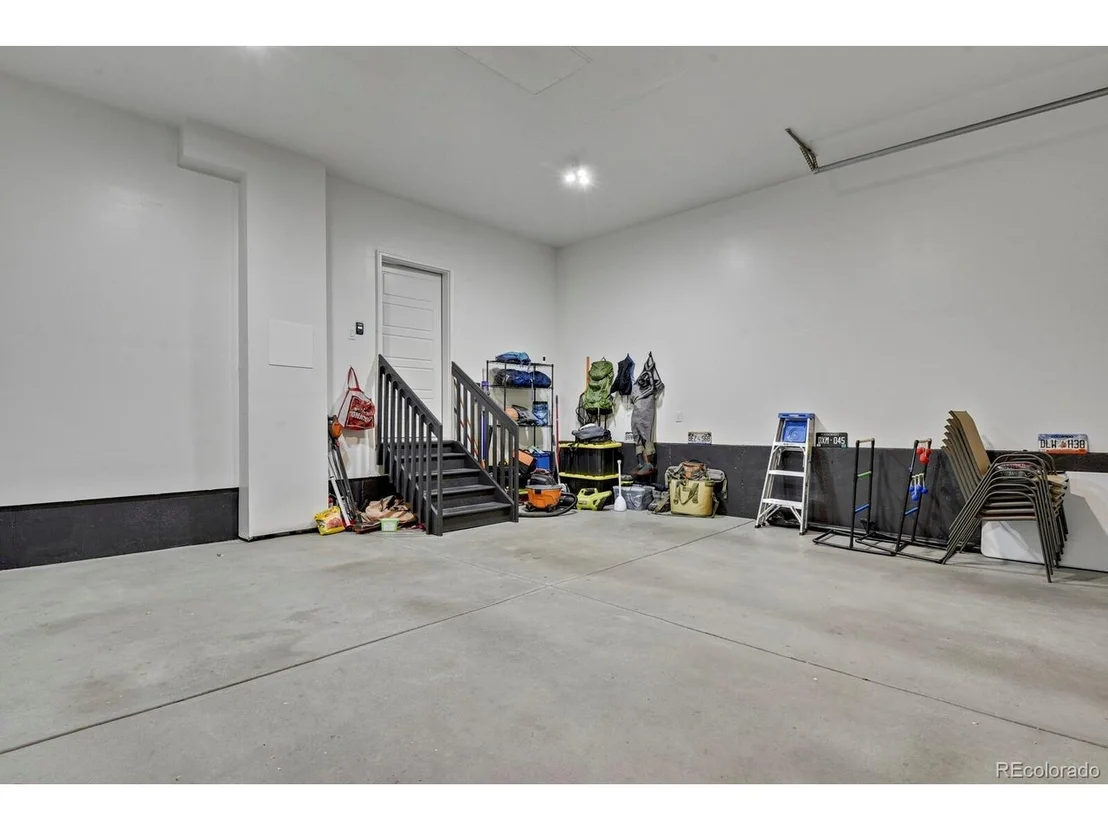
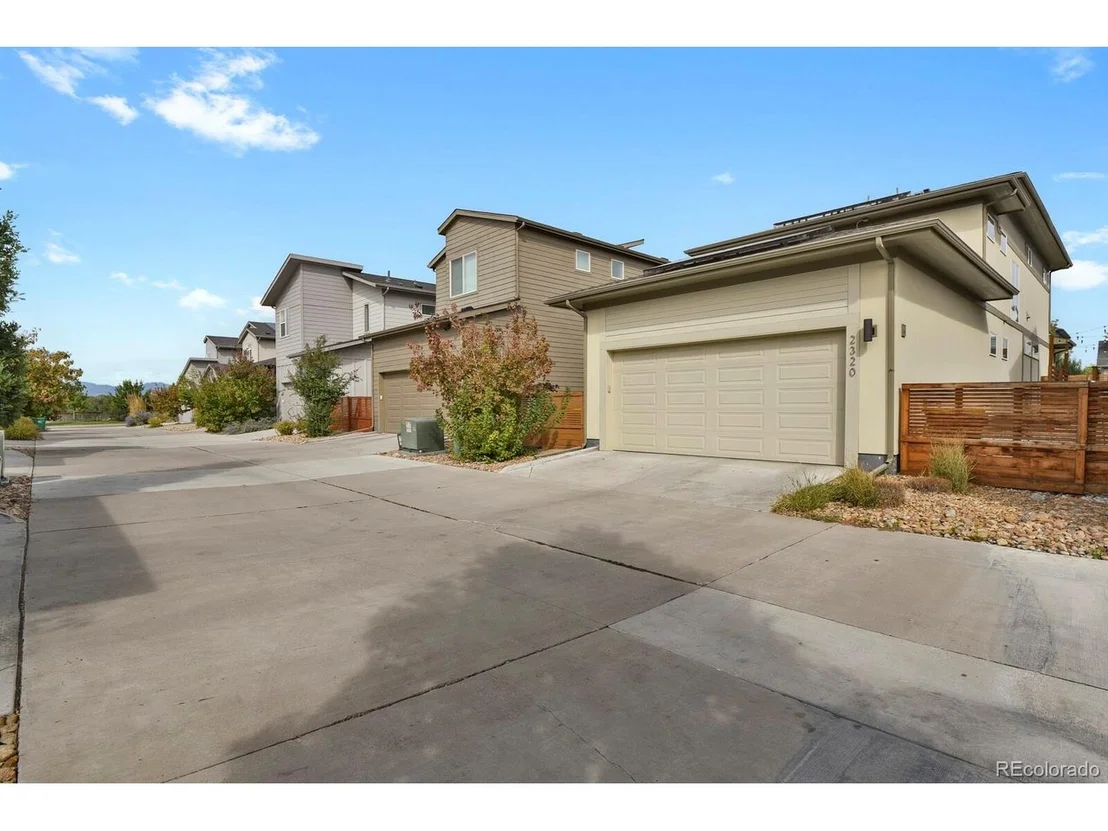
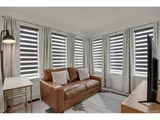
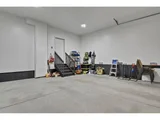
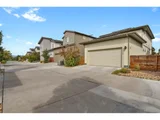
The oversized attached two-car garage is finished and insulated with alley access. Additional updates include new bathroom vanities, carpet, paint, lighting, custom window coverings, and a tankless water heater. Paid-off solar with Xcel energy banking adds efficiency, while radon mitigation and a sump pump were installed in 2024.
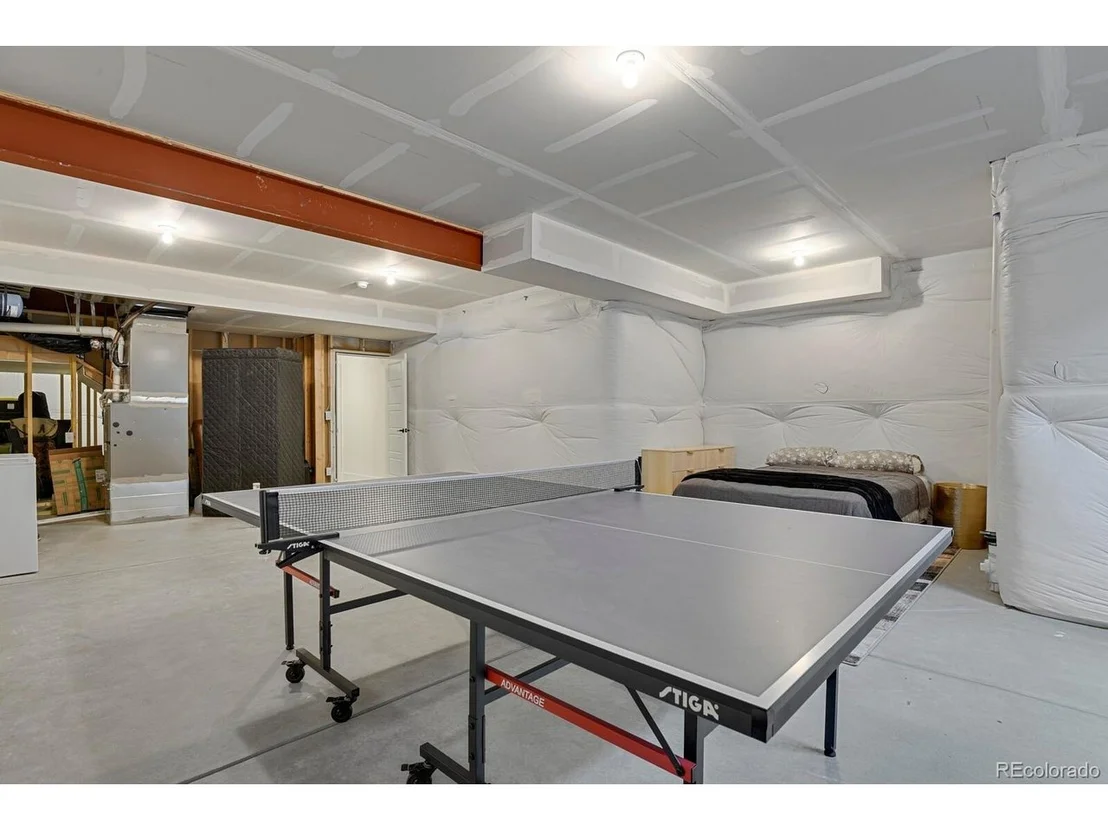
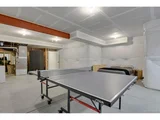
The unfinished basement offers 9-foot ceilings, egress windows, and roughed-in plumbing, ready for whatever comes next.
And then there's Midtown. Enjoy parks, trails, open space, neighborhood events, and local favorites like Bruz Beers and Early Bird Restaurant, all with convenient access to Denver, Boulder, and major transportation routes.
Listed By
Payment Calculator
Your Estimated Monthly Payment
Cap Rate Calculator
What does this mean?
Based on our analysis, the cap rate of this property is 1.25%. A negative cap rate indicates that the property might not be feasible as an income-producing asset. The median cap rate for a near zip code 11238 is 4.23%.
How much can I actually make?
Actual monthly rental income may vary between $4,760 and $7,140 depending on unit-specific characteristics. You can change the amount using the slider to further explore.
How is cap rate calculated?
Cap Rate = Net Operating Income (NOI) / Property Asset Value.
When calculating the cap rate, we assume 100% occupancy. Leverage (mortgage) is not considered.
Cap Rate provided by RealtyHop and RentHop, learn more about cap rate here.
Price History
| Date / Event | Date | Event | Price |
|---|---|---|---|
| Nov 15, 2026 | Price Decreased |
$719,000
↓ $20K
(2.7%) | |
| Price Decreased | |||
| Nov 4, 2026 | Price Decreased |
$739,000
↓ $21K
(2.8%) | |
| Price Decreased | |||
| Sep 30, 2026 | Listed | $759,900 | |
| Listed | |||
| May 21, 2024 | Sold | ||
| Sold | |||
| May 21, 2024 | Listed | $815,000 | |
| Listed | |||
| | |||

Property Highlights
Building Info
Comparables
Status
Price/ft²
Listed On
Sold On
About Twin Lakes
Similar Homes for Sale
Currently no similar homes aroundNearby Rentals

Last Updated: 8 days ago
Data Source: REcolorado MLS, MLS# IRE4934204


















 Your Privacy Choices
Phone: 425-283-2930
Address: 335 Madison Avenue, New York, NY 10017