New York City is one of the most expensive cities in the U.S. to rent in so one can only imagine the price tags of the units actually for sale. Investing in real estate in New York City can be expensive, but nevertheless, an investment if NYC is the city where you see yourself living for the rest of your life. With more than 8.5 million people residing, across the five boroughs, there are plentiful of housing and investment opportunities for those looking to purchase real estate. This monthly report has its focus on the previous transactions made in January, showing the most expensive transactions (commercial transactions excluded), celebrity transactions, and some statistics to go along with it. The data for the report is provided by ACRIS.
Some information about ACRIS
With data publicly available by ACRIS (ACRIS being the Automated City Register Information System) the public can search property records and view documents for Manhattan, Queens, Bronx, and Brooklyn from 1966 to the present. While RealtyHop has incorporated a feature that allows users of the site to conduct their own searches for buy/sell events by individuals, organizations, or property addresses, a report showing the number of transactions made in the past month as well as some insight to what properties go for, in which borough, has been provided in the report.
A brief look at the month of January
Total transactions statistics:

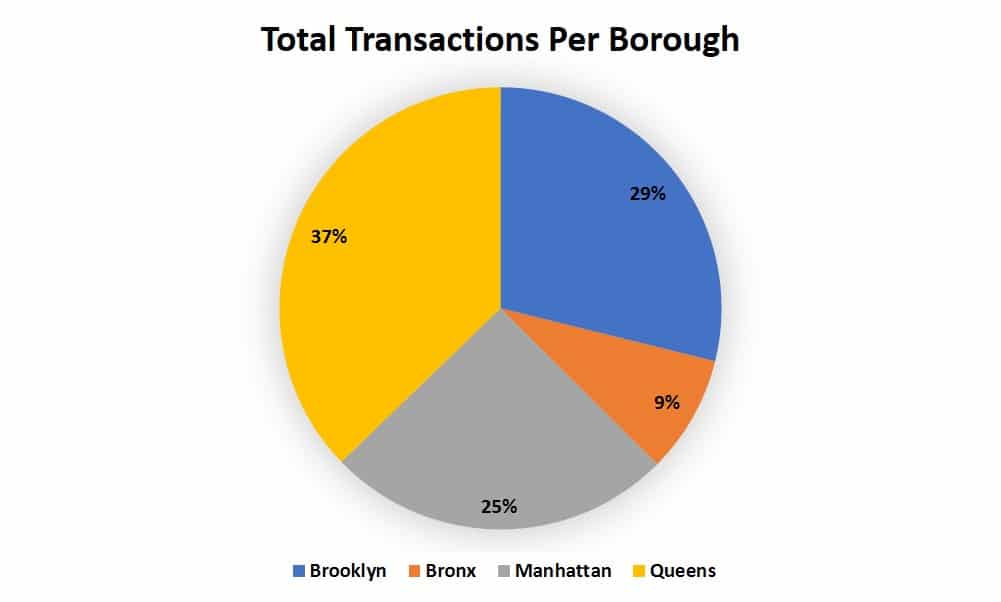
- Unsurprisingly, Queens ends up in first place for the month of January, with 37% of the total sales transaction. That is 3% higher than for the month of December.
- Coming in at second place we have Brooklyn, yet again. In 2018, we saw Manhattan come in at second place more often than Brooklyn but for the past months Brooklyn has been taking second place when it comes to the total number of sales transactions for the past months. For January, Brooklyn ended up with 29% of all transactions.That is a decrease of 1% from December.
- Manhattan ends up with 25% of the total sales transactions for January. That means, Manhattan ended up with the same amount of shares for sales transactions in January as it did in December.
- Finally, we have the borough of Bronx, who ended up with 9% of the total transactions. The share stays the same as for the month of December.
Median closing price per borough:

-
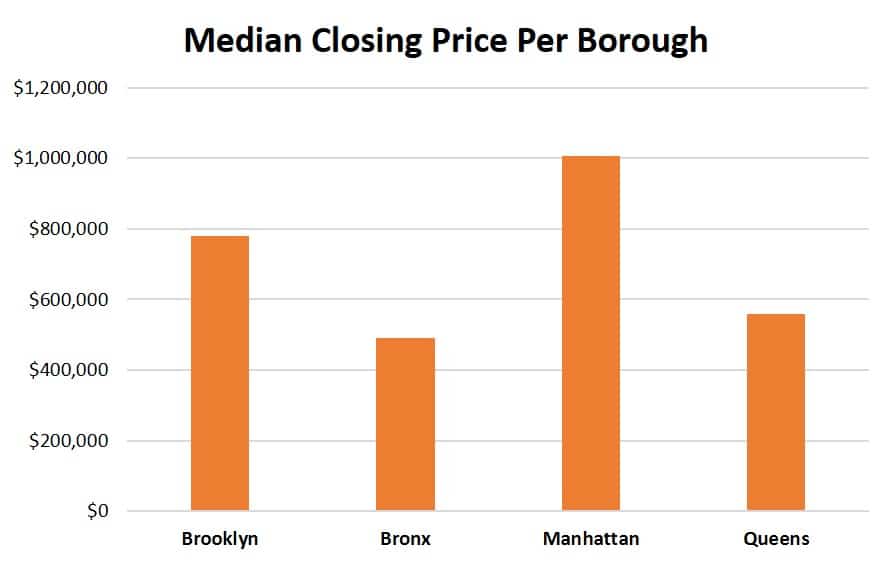
- While there were some big and costly transactions in Manhattan in January, that didn’t distort the median price that much as Manhattan ended up with a median closing price of $1,005,000. That is actually $95,000 less than the median closing price for December.
- Brooklyn also ended up with a lower median closing price than for December. For January, the borough ended up with a median closing price of $780,000, that is $20,000 less than for the previous month.
- Queens ended up with a median closing price of $560,000. That is also less than for the month of December, by $15,000.
- Bronx ended up with a very slight increase in the median closing price for January, by $5,000. For January, Bronx ended up with $490,000 as the median closing price for January.
An overview of the total transactions made in January
The table below shows the total transactions in January for the boroughs Manhattan, Brooklyn, Queens, and The Bronx. Obvious commercial transactions have been removed from the table (as well as any transactions that didn’t clearly show if it was a commercial transaction or not). The data in the table is provided by ACRIS for the month of January and ranks the transactions by the most expensive. We limited the transactions listed below to those of the cost of $100,000 and above. To search for transactions by borough, please refer to using the search field.***
With data from ACRIS, RealtyHop is able to disclose the total number of transactions as well as the boroughs with the most transactions in the past month. We here at RealtyHop look for insight into the real estate market to provide buyers with as much information as possible so they can make an informed buying decision.
