
As home prices continue to rise, young people have felt the American dream of homeownership quickly slipping away. However, as millennials and Gen Zers voiced their frustrations, the previous generation pushed back, arguing that buying a home years ago was just as expensive. This exchange has sparked a generational clash, igniting tensions and passionate discussions between both sides.
In our Generational Wealth Gap series, we answer whether housing is more expensive for younger people today. This is the last report of our three-part series, which focuses on housing affordability in 1970 vs. 2022 in some of the largest cities in the United States.
Our key findings include:
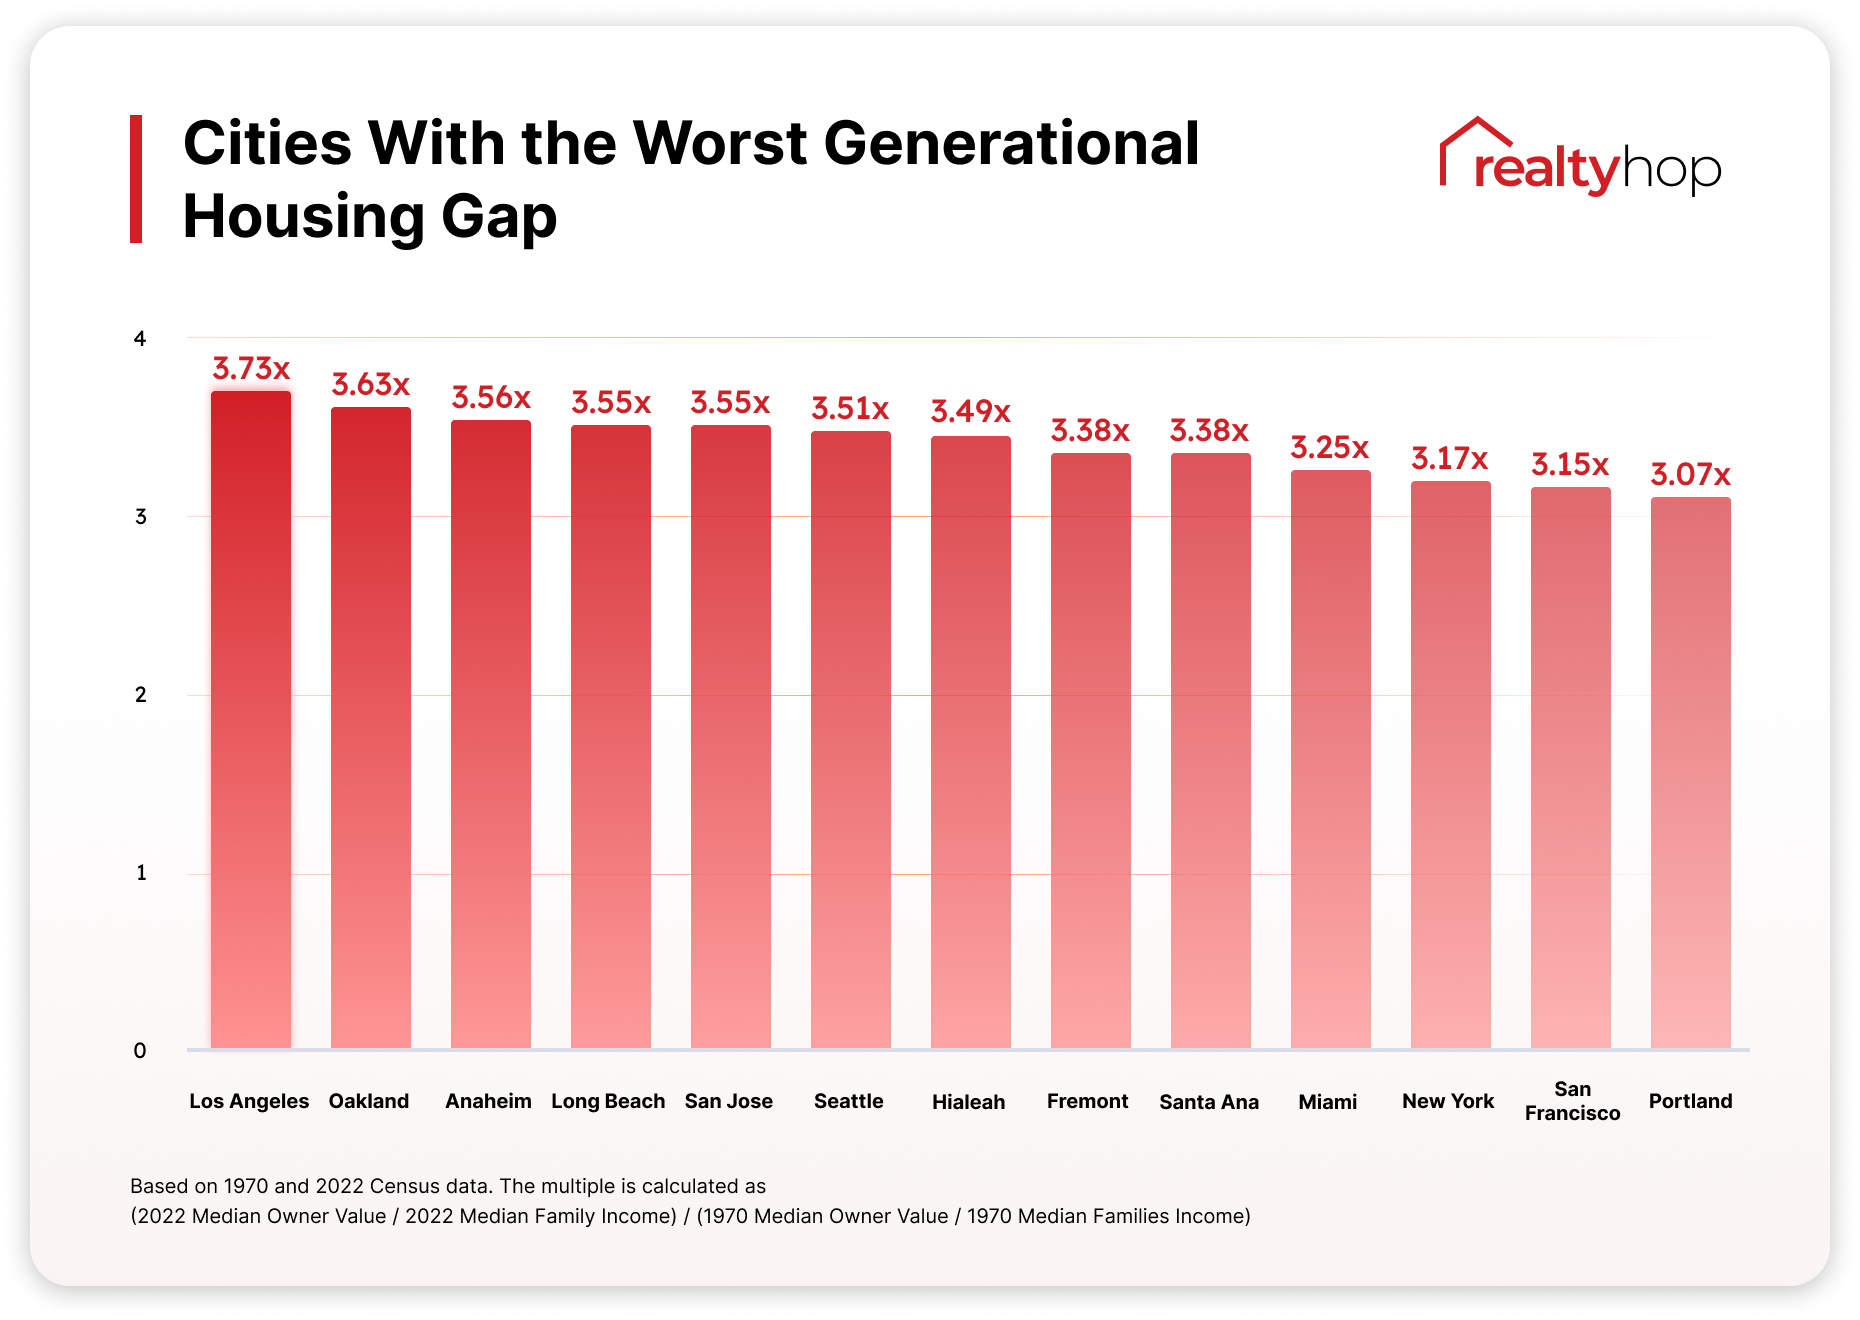
- Housing has become 3.73 times more expensive for an average Los Angeles family since 1970.
- The top five cities where housing affordability worsened are all located in California – Los Angeles, Oakland, Anaheim, Long Beach, and San Jose. The state as a whole experienced a 192% decrease in housing affordability.
- Homes are 3.25 times more unaffordable for average families in Miami. The nearby Hialeah has seen similar trends, with housing being 3.49x more unattainable since 1970.
- The booming technology industry contributed to the worsening housing affordability. 14 of the 20 top cities in the report are major cities with tech talent.
To do this, we pulled statistics from the most recent 2022 U.S. Census and compared those to the same numbers from the 1970 Census, when Baby Boomers were beginning to purchase starter homes. Read on to see the results.
A Generational Wealth Gap Has Formed
Is housing more expensive for young people today, even after factoring in wage growth? To answer our question, we compared two main statistics from the U.S. Census:
- Median Family Income (in the 1970 Census, the data was labeled as “Median Families Income”)
- Median Value of Owner-Occupied Housing Units: each homeowner’s estimate of how much their property would sell for if it were on the market.
- From these statistics, we could then calculate a Housing Unaffordability Multiple for each city: how many multiples of family income it would take to purchase a home in 1970 vs. in 2022. Here’s how it’s calculated:
- Assuming that
- 1970 Median Families Income = $9,000
- 1970 Median Value = $15,000
- 2022 Median Family Income = $90,000
- 2022 Median Value = $450,000
- Housing Unaffordability Multiple = ( 2022 Median Value / 2022 Median Family Income ) / ( 1970 Median Value / 1970 Median Families Income) = ($450,000 / $90,000) / ($15,000 / $9000) = 3
- Assuming that
The Housing Unaffordability Multiple provided an abundantly clear answer: housing is far less affordable now than when previous generations purchased their first home.
Housing Unaffordability Multiples by City
The map below breaks down our findings by city. The larger the bubble, the bigger the Housing Unaffordability Multiple.
Cities With the Worst Generational Housing Affordability Gap
While housing nationwide has become significantly more expensive, certain cities were more affected. Housing is 3.73 times more unaffordable for an average family in Los Angeles now than in 1970. Oakland, the third largest city in the Bay Area, is not far behind. It is 3.17 times harder for average families in Oakland to own than for their parent’s generation. It’s worth noting that seven of the top 10 cities are located in California.
Cities that Remained Affordable Since 1970
In some cities, housing has remained steady in the past five decades. In Detroit, housing affordability has actually improved since 1970 due to the lack of housing demand. With a multiple of 0.74x, it’s easier for an average family in Detroit to purchase a home than for their parents or grandparents. Cleveland, where the city’s population has decreased by 50.68% since 1970, has also maintained its affordability.

Tech Industry Drove Up Home Values in Major Hubs
While housing demand is largely driven by population growth, in some markets, we noticed that the leading tech industry and the resulting higher incomes also contributed to the worsening housing affordability. The chart below illustrates the relationship between population growth and housing unaffordability. Seattle appeared in 1970 as a booming tech city, and by 1995, Microsoft, with headquarters in Seattle, became the most profitable company in the world. Home appreciation outpaced wage growth, and today, it’s 5.2 times harder for a young Seattle family to buy a home than in 1970.

Methodology
To determine the housing affordability gap between generations in America, the RealtyHop team extensively reviewed the 1970 and 2022 U.S. Census reports and calculated the housing multiple using the following data points:
- 1970 Median Owner Home Value by City
- 1970 Median Families Income by City
- 2022 Median Owner Home Value by City
- 2022 Median Families Income by City
While median household income is often the most widely adopted measure when analyzing income levels, we utilized the median families income data, as the 1970 median household income data was not released at a state level. Using median families income would ensure that we compare the income levels fairly. It’s worth noting that family households are still the majority of households in the U.S. About two-thirds of all U.S. households in 2020 were family households, the same share as a decade earlier; married-couple households accounted for about 71% of these households.
For more information on our methodology or to contact our data team, please email [email protected]. You can also check out our Metro Generational Wealth Gap for more detailed coverage of how housing affordability has exacerbated in 50 of the largest metros in the U.S.