
With the announcement of Amazon’s new headquarters, many have decried the behemoth’s decision to choose two already-prosperous cities, invoking arguments often used in denouncing the increasing inequality in the US today. And the rich do indeed get richer, not just in terms of Amazon HQs, with inequality that continues to be visible and ever-rising among Americans. With an awareness for this rising inequality, RealtyHop’s data science team has analyzed inequality within the realm of residential real estate prices.
To do so, we’ve looked into pricing dispersion among the top 20 most populated counties in the United States, which we define by taking the interquartile range of residential listing prices. Put more simply, this measures how large of a price gap there is in residential real estate for a given county.

In exploring the pricing dispersion of these areas, we’ve also paid close attention to the distribution of housing prices and how that has shifted over the quarter. As you’ll see below, areas where pricing dispersion has decreased are also coupled with decreases in the upper quartile of housing prices, suggesting that the luxury or higher-end housing market is cooling faster than the median/lower quartile.
Key Findings
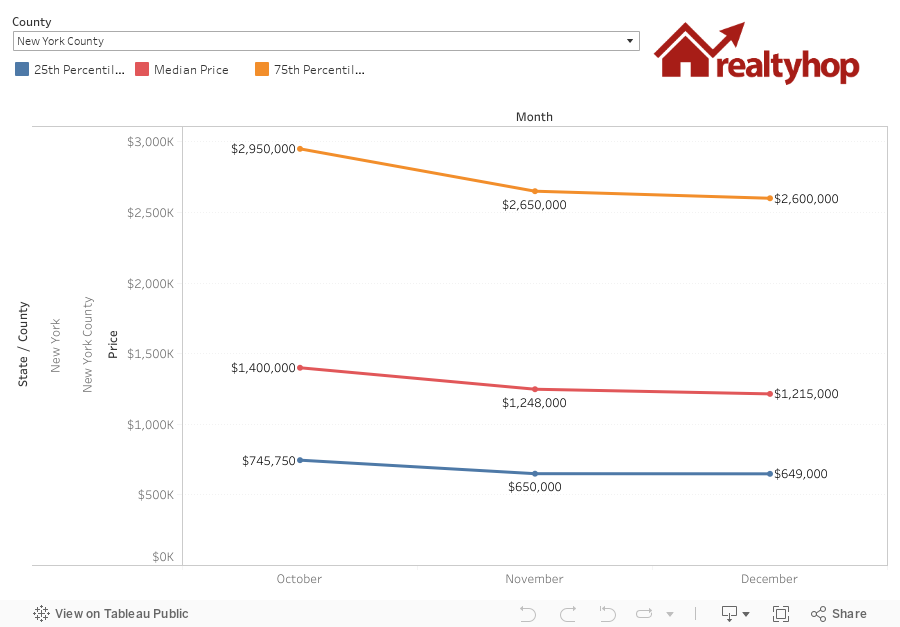
- This indicates that the person purchasing a home around the top 25th price percentile of New York County will pay $2 million more than the bottom 25th percentile.
- With the bottom 25th price percentile for New York County coming in around $649,000, one could buy 4 properties in the bottom 25th percentile for the same price as a property in the top 25th percentile.
- This corresponds to a $215K (Bay Area) and $110K (Seattle) drop in price dispersion, which indicates that the prices of houses are converging and that housing price inequality in these areas is dropping.
- That said, the top 75th percentile of listed housing prices has also dropped noticeably in both Seattle and the Bay Area, which is driving the majority of the decrease in price dispersion.
- This decrease in the top 75th percentile of listed housing prices is likely caused by some combination of increased interest rates, market corrections in the tech sector, and the various nuances of the housing markets in the areas in question.
Housing Price Dispersion
We’ve combed through RealtyHop’s proprietary data to build a comprehensive index of housing dispersion in a number of different counties, looking to identify the interquartile range between housing prices. By doing so, we capture the price gap between housing stock across the country. A higher price dispersion number suggests a higher amount of inequality, indicating a positive relationship between the two. With this in mind, however, singular data points should be taken in context, and conclusions should only be drawn from clear trends and not one-off peaks or troughs.
See the below table for the average price dispersion looks over the 3 month period (from Oct 2018 to the end of Dec 2018):
Infographic
Use the interactive widget below to see how different counties compare– the below graph will show the 25th percentile, median, and 75th percentile housing price in a given county. The pricing dispersion is the gap between the 75th percentile and the 25th percentile (the orange and the blue line, respectively). You can filter by any of the top 20 counties.
Data Considerations
What Does This Mean For You?
On its own, the pricing dispersion for a given county is more descriptive than prescriptive– for those looking to purchase a home (either for a primary residence or for investment purposes), however, understanding how prices skew in a given county is incredibly important. For example, if in a given county there’s a lot of affordable housing construction, one may feel differently about purchasing a house within the lower band of price percentiles. As said housing stock becomes more commonplace, it may prove to be a less attractive investment.
Appendix: By-Month Data Table
The data table below shows the past 3 months worth of housing prices by county, the pricing dispersion by month, and the census population associated with said county.