
We have all been there, enjoying a beautiful afternoon, maybe walking to meet some friends for dinner. Suddenly – SQUISH – uh-oh. In a split second, there is a rush of feelings: anger, sadness, embarrassment or maybe even nausea. You look down, yes, you just stepped in poop. It smells, like really smells, not to mention the awkwardness when you actually step on it. You could not help but wonder “who on earth doesn’t clean up after their furry little friends?”
Dog feces are not the only type of poop we have to deal with, unfortunately. In many metropolitan cities, human waste is a big issue. It is the dark side of those cities that seem so great until you actually have to live there. Poop is not only a major environmental pollutant, but it also indicates the cleanliness of a city, which is a huge part of a city’s brand. No wonder that cities around the world, including New York, Madrid, and London, all have their ways of dealing with the poop crisis, such as enforcing poop fines and launching sidewalk cleaning programs. Unfortunately, we still keep seeing the word “poop” in the headlines, and we could not help but ask “has the poop crisis reached a whole new level?” To answer this question and further understand the poop crisis, we looked into 311 poop complaints in three major U.S. cities[1] — Chicago, New York City, and San Francisco.
Here are some of our findings:
- San Francisco is the Doo-Doo Capital in the U.S., with 455.89 poop sightings reported per Sq Mi in 2017. (Figure 1)
- In Chicago, we found a positive correlation between homeownership and the number of poop complaints. The more units are owned in one neighborhood, the more poop complaints filed. (Figure 2)
- We also found a significant negative correlation between median home value and poop complaints within a zip code in Chicago. Zip codes with higher home value tend to have fewer poop complaints. (Figure 3)
- The Bronx was the dirtiest borough in New York City in 2017 by the number of unique poop complaints per Sq Mi. However, there has been more poop complaints in Manhattan so far in 2018. As of August 31st, Manhattan saw on average 9.6 complaints per Sq Mi. (Figure 8)
- While there is no correlation between homeownership and poop in New York City, there is a statistically significant negative correlation between median home value and poop complaints within a zip code. The higher the median home value, the fewer the poop complaints. (Figure 9)
- In San Francisco, 2017 was the worst year on record, with 20,899 poop complaints reported. But 2018 is on track to beat that. (Figure 13)
To begin, we looked at the poop complaints data of each city. Figure 1 below shows the total number of complaints in 2017 in each city and the number of complaints per square mile. Poop complaints consist of both animal waste and human waste sightings. San Francisco received almost 10 times more poop complaints than New York City, the largest city in the U.S.
| Poop Complaints in 2017 | Complaints Per Sq Mi | |
| Chicago | 955 | 4.08 |
| New York City | 2,458 | 8.12 |
| San Francisco | 20,890 | 455.89 |
While one might think there is no science in poop complaints, we at RealtyHop were able to find some fascinating trends. The interactive maps below show the concentrations of waste complaints by neighborhood in Chicago, New York City, and San Francisco. To rank fairly among neighborhoods, we normalized the number of complaints by the number of households within a neighborhood, according to the most recent Census data[2] available. As one would assume that an area with more households will also have more complaints, normalizing the data using the number of households allows us to correct such bias. We also removed duplicate complaints to ensure repeated same-day callers about the same waste does not tilt the data.
Chicago
We have some great news for the Windy City – while ranked the rat capital in the country, Chicago is not the dirtiest city if you consider only the poop complaints! While there are around 5,700 homeless individuals in Chicago, human waste does not seem to be a major issue, as around 72% of them are sheltered, according to City of Chicago. For Chicagoans, it’s all about dog poop. It is such a big deal that some have even gone to drastic measures like DNA testing the poop to prove whose dog it came from. But based on the number of unique poop complaints, Chicago is a lot cleaner.
Where to Watch Out
These are the Dirtiest Neighborhoods
- West Englewood – 26.94 Average Yearly Complaints/Per 10,000 Households – 24 complaints in 2017, 23 complaints in 2018 as of Aug 31st.
- West Pullman – 22.63 Average Yearly Complaints/Per 10,000 Households – 19 complaints in 2017, 18 complaints in 2018 as of Aug 31st.
- Hermosa – 20.25 Average Yearly Complaints/Per 10,000 Households – 20 complaints in 2017, 6 complaints in 2018 as of Aug 31st.
- Ashburn – 20.18 Average Yearly Complaints/Per 10,000 Households – 46 complaints in 2017, 21 complaints in 2018 as of Aug 31st.
- Chicago Lawn – 19.58 Average Yearly Complaints/Per 10,000 Households – 41 complaints in 2017, 29 complaints in 2018 as of Aug 31st.
These are the Cleanest Neighborhoods
- Near North Side – 0.58 Average Yearly Complaints/Per 10,000 Households – 3 complaints in 2017, 2 complaints in 2018 as of Aug 31st.
- O’Hare – 0.79 Average Yearly Complaints/Per 10,000 Households – 1 complaint in 2017, 0 complaints in 2018 as of Aug 31st.
- Hyde Park – 1.00 Average Yearly Complaints/Per 10,000 Households – 0 complaints in 2017, 1 complaint in 2018 as of Aug 31st.
- The Loop – 1.04 Average Yearly Complaints/Per 10,000 Households – 2 complaints in 2017, 3 complaints in 2018 as of Aug 31st.
- Kenwood – 1.12 Average Yearly Complaints/Per 10,000 Households – 2 complaints in 2017, 0 complaints in 2018 as of Aug 31st.
Poop Complaints vs. Homeownership
Besides geographical location and proximity to the city center, we also found a correlation between the number of poop complaints and whether a unit is owned or rented. Figure 2 illustrates the significant correlation (r=0.2495) between homeownership and average yearly complaints per 10,000 households. With p = 0.02850, it is unlikely that the correlation we found is a coincidence (whenever p-value is less than 0.5 it is likely not a coincidence). Indeed, correlation does not equal causation, but we do get a glimpse into what types of neighborhoods generate complaints. Maybe homeowners are more likely to complain when they spot animal or human feces? Maybe homeowners are more likely to have dogs? Or maybe homeowners are worse at cleaning after their pets? One cannot say from the available data.

The Higher the Median Home Value, the Fewer the Complaints
Additionally, when we looked at the data at a zip code level, we found another trend. As shown in Figure 3, there was a statistically significant negative correlation (r = -0.5608) between median home value and the number of poop complaints per 10,000 households within a zip code. Put simply, the more expensive a zip code is the fewer the complaints. In this case, the p-value is smaller than 0.0001, which strongly indicates that it is less likely a coincidence. It could be that high-end buildings have staffers clean up the sidewalks and yards, or that many residents hire professional dog walkers to walk their dogs. Or, maybe the high pet fees are discouraging people from having pets?

Is the Poop Crisis in Chicago Worsening?
The poop crisis in Chicago reached its peak in 2016. As shown in Figure 4, the number of unique poop complaints spiked from 828 in 2015 to 1,090 in 2016. Soon after that, the number decreased to 955 in 2017. Seems like a good sign, right? However, if we factor in the data of 2018, things do not look good. As of August 31st, Chicago has seen 648 poop complaints in 2018, averaging 81 per month. If the number of poop complaints continues at its current pace, by the end of this year we might see over 970 poop complaints in Chicago, making it one of the bad years.

When to Watch Out
Since predicting where you will spot poop was not enough, we dug deeper. Figure 5 shows the number of poop complaints by month. Did you know that you are less likely to step on poop from November to January, and March has been historically the top month for complaints? Specifically, the city received the most complaints (233) in March 2015. Perhaps, as the snow thaws, little poopsicles finally reveal themselves.

We also broke down complaints by day of the week. Based on the historical data, Monday seems to be the busiest day, followed closely by Tuesday and Wednesday. It looks like Chicagoans take a break from calling in/going online and making complaints over the weekend, but once Monday comes (and with the Monday blues of course), they are not going to put up with that sh**.

New York City
There are over 84,000 registered dogs in New York City, and the Department of Health estimates that is just 20% of the total dog population. It is not surprising, then, for New Yorkers to be stepping on poop every once in a while. Aside from having hundreds of thousands of dogs around, New York City also has the most homeless population. There are over 77,000 homeless individuals in New York City, according to the most recent Annual Homeless Assessment Report to Congress by the U.S. Department of Housing and Urban Development. So, exactly how bad is the poop crisis in the Big Apple? Let us take a look.
Where to Watch Out
Since New York City consists of 5 boroughs, we also compared the number of poop complaints by borough. Figure 7 includes all poop incidents from January 2011 to December 2017. Queens topped other boroughs in 2013, but the poop crisis quickly improved in the following years. The Bronx had the most poop complaints in 2017, with 711 incidents reported.

Based solely on the number of unique complaints, the Bronx seems to be the dirtiest borough. However, let us not forget that the size of a borough does matter. Bigger boroughs mean more land space and more households. Therefore, to further investigate the poop crisis, we normalized the data by the land area. Note that the 2018 data only covers complaints from January through August.
| Total # of Complaints | # of Complaints in 2017 | # of Complaints in 2018 | 2017 Complaints/Sq Mi | 2018 Complaints/Sq Mi | |
| Manhattan | 2,359 | 299 | 220 | 13.1 | 9.6 |
| Brooklyn | 5,691 | 685 | 461 | 9.7 | 6.5 |
| Queens | 5,593 | 623 | 478 | 5.7 | 4.4 |
| The Bronx | 5,442 | 711 | 392 | 16.9 | 9.3 |
| Staten Island | 1,362 | 140 | 104 | 2.4 | 1.8 |
What’s our takeaway from the table above? Well, surprisingly, Manhattan has outpaced the Bronx in 2018 to become the dirtiest borough with 9.6 complaints per square mile! Staten Island, on the other hand, is the cleanest borough. Could it be that dog owners on Staten Island are more responsible? Or perhaps, there are fewer homeless people? One could not tell from the data. Aside from analyzing the poop complaints by borough, we also looked at the number of poop complaints by neighborhood. The map below illustrates the “poop-ness” of NYC neighborhoods, and similar to what we’ve noticed in Chicago, neighborhoods farther away from the city center tend to have more poop complaints. Most people assume that Chinatown is one of the dirtier neighborhoods, but according to the data, it is, in fact, the second cleanest neighborhood (after Stuy-Town) in Manhattan!
The Worst Neighborhoods By Borough
- Soundview-Bruckner (the Bronx)– 46 Average Yearly Complaints/Per 10,000 Households – 33 complaints in 2017, 5 complaints in 2018 as of Aug 31st.
- Ozone Park (Queens) – 20.3 Average Yearly Complaints/Per 10,000 Households – 10 complaints in 2017, 9 complaints in 2018 as of Aug 31st.
- Cypress Hills-City Line (Brooklyn) – 19.1 Average Yearly Complaints/Per 10,000 Households – 35 complaints in 2017, 16 complaints in 2018 as of Aug 31st.
- Mariner’s Harbor-Arlington-Port Ivory-Graniteville (Staten Island) – 18.0 Average Yearly Complaints/Per 10,000 Households – 12 complaints in 2017, 2 complaints in 2018 as of Aug 31st.
- Hamilton Heights (Manhattan) – 11.5 Average Yearly Complaints/Per 10,000 Households – 16 complaints in 2017, 16 complaints in 2018 as of Aug 31st.
The Cleanest Neighborhoods By Borough
- Stuyvesant Town-Cooper Village (Manhattan) – 0.8 Average Yearly Complaints/Per 10,000 Households – 0 complaints in 2017, 0 complaints in 2018 as of Aug 31st.
- Brooklyn Heights-Cobble Hill (Brooklyn) – 1.0 Average Yearly Complaints/Per 10,000 Households – 2 complaints in 2017, 0 complaints in 2018 as of Aug 31st.
- Co-op City (the Bronx) – 2.1 Average Yearly Complaints/Per 10,000 Households – 6 complaints in 2017, 10 complaints in 2018 as of Aug 31st.
- Springfield Gardens North (Queens) – 3.1 Average Yearly Complaints/Per 10,000 Households – 4 complaints in 2017, 4 complaints in 2018 as of Aug 31st.
- Grymes Hill-Clifton-Fox Hills (Staten Island) – 6.9 Average Yearly Complaints/Per 10,000 Households – 5 complaints in 2017, 2 complaints in 2018 as of Aug 31st.
The Higher the Median Home Value, the Fewer the Poop Complaints
Unlike what we have seen in Chicago, in the Big Apple, the number of complaints is not correlated to homeownership. However, when we analyzed the data at a zip code level, we found a significant negative correlation (r = -0.3625, p-value < 0.0001) between the number of poop complaints per 10,000 households and median home value within a zip code, as shown in Figure 9. So, if you live in TriBeCa or SoHo (both have some of the most expensive zip codes in New York City) you probably do not see many brown poopsickles around. But if you are in Woodlawn Heights, which consists of some of the less expensive zip codes, you might find yourself complaining about poop every once in a while.

Is the Poop Crisis Worsening?
Good news for New Yorkers – the answer is no! According to the 311 data, the number of reported poop has been decreasing since 2011. Figure 10 below shows the number of unique complaints by year. As you can see, when the city first started collecting the 311 data in 2011, the total number of complaints in that one year reached over 3,000. Since then, the number gradually improved, to 2,407 in 2014. The city saw in total 2,458 complaints in 2017, which is 20.5% fewer than in 2011. With Mayor de Blasio pledging to crack down the poop issue, we will continue to see cleaner streets.

When to Watch Out
In addition to where to watch out, we also broke down complaints by month and day of the week. In New York City, February and March are historically the worst months. The situation, then, improves as the weather gets warmer, and the number of complaints stays low throughout the rest of the year. Moreover, it seems that 2018 is going to be a good year. March 2018 marked the best month of March in eight years, with only 176 poop complaints. The number continues to stay low compared to other years.

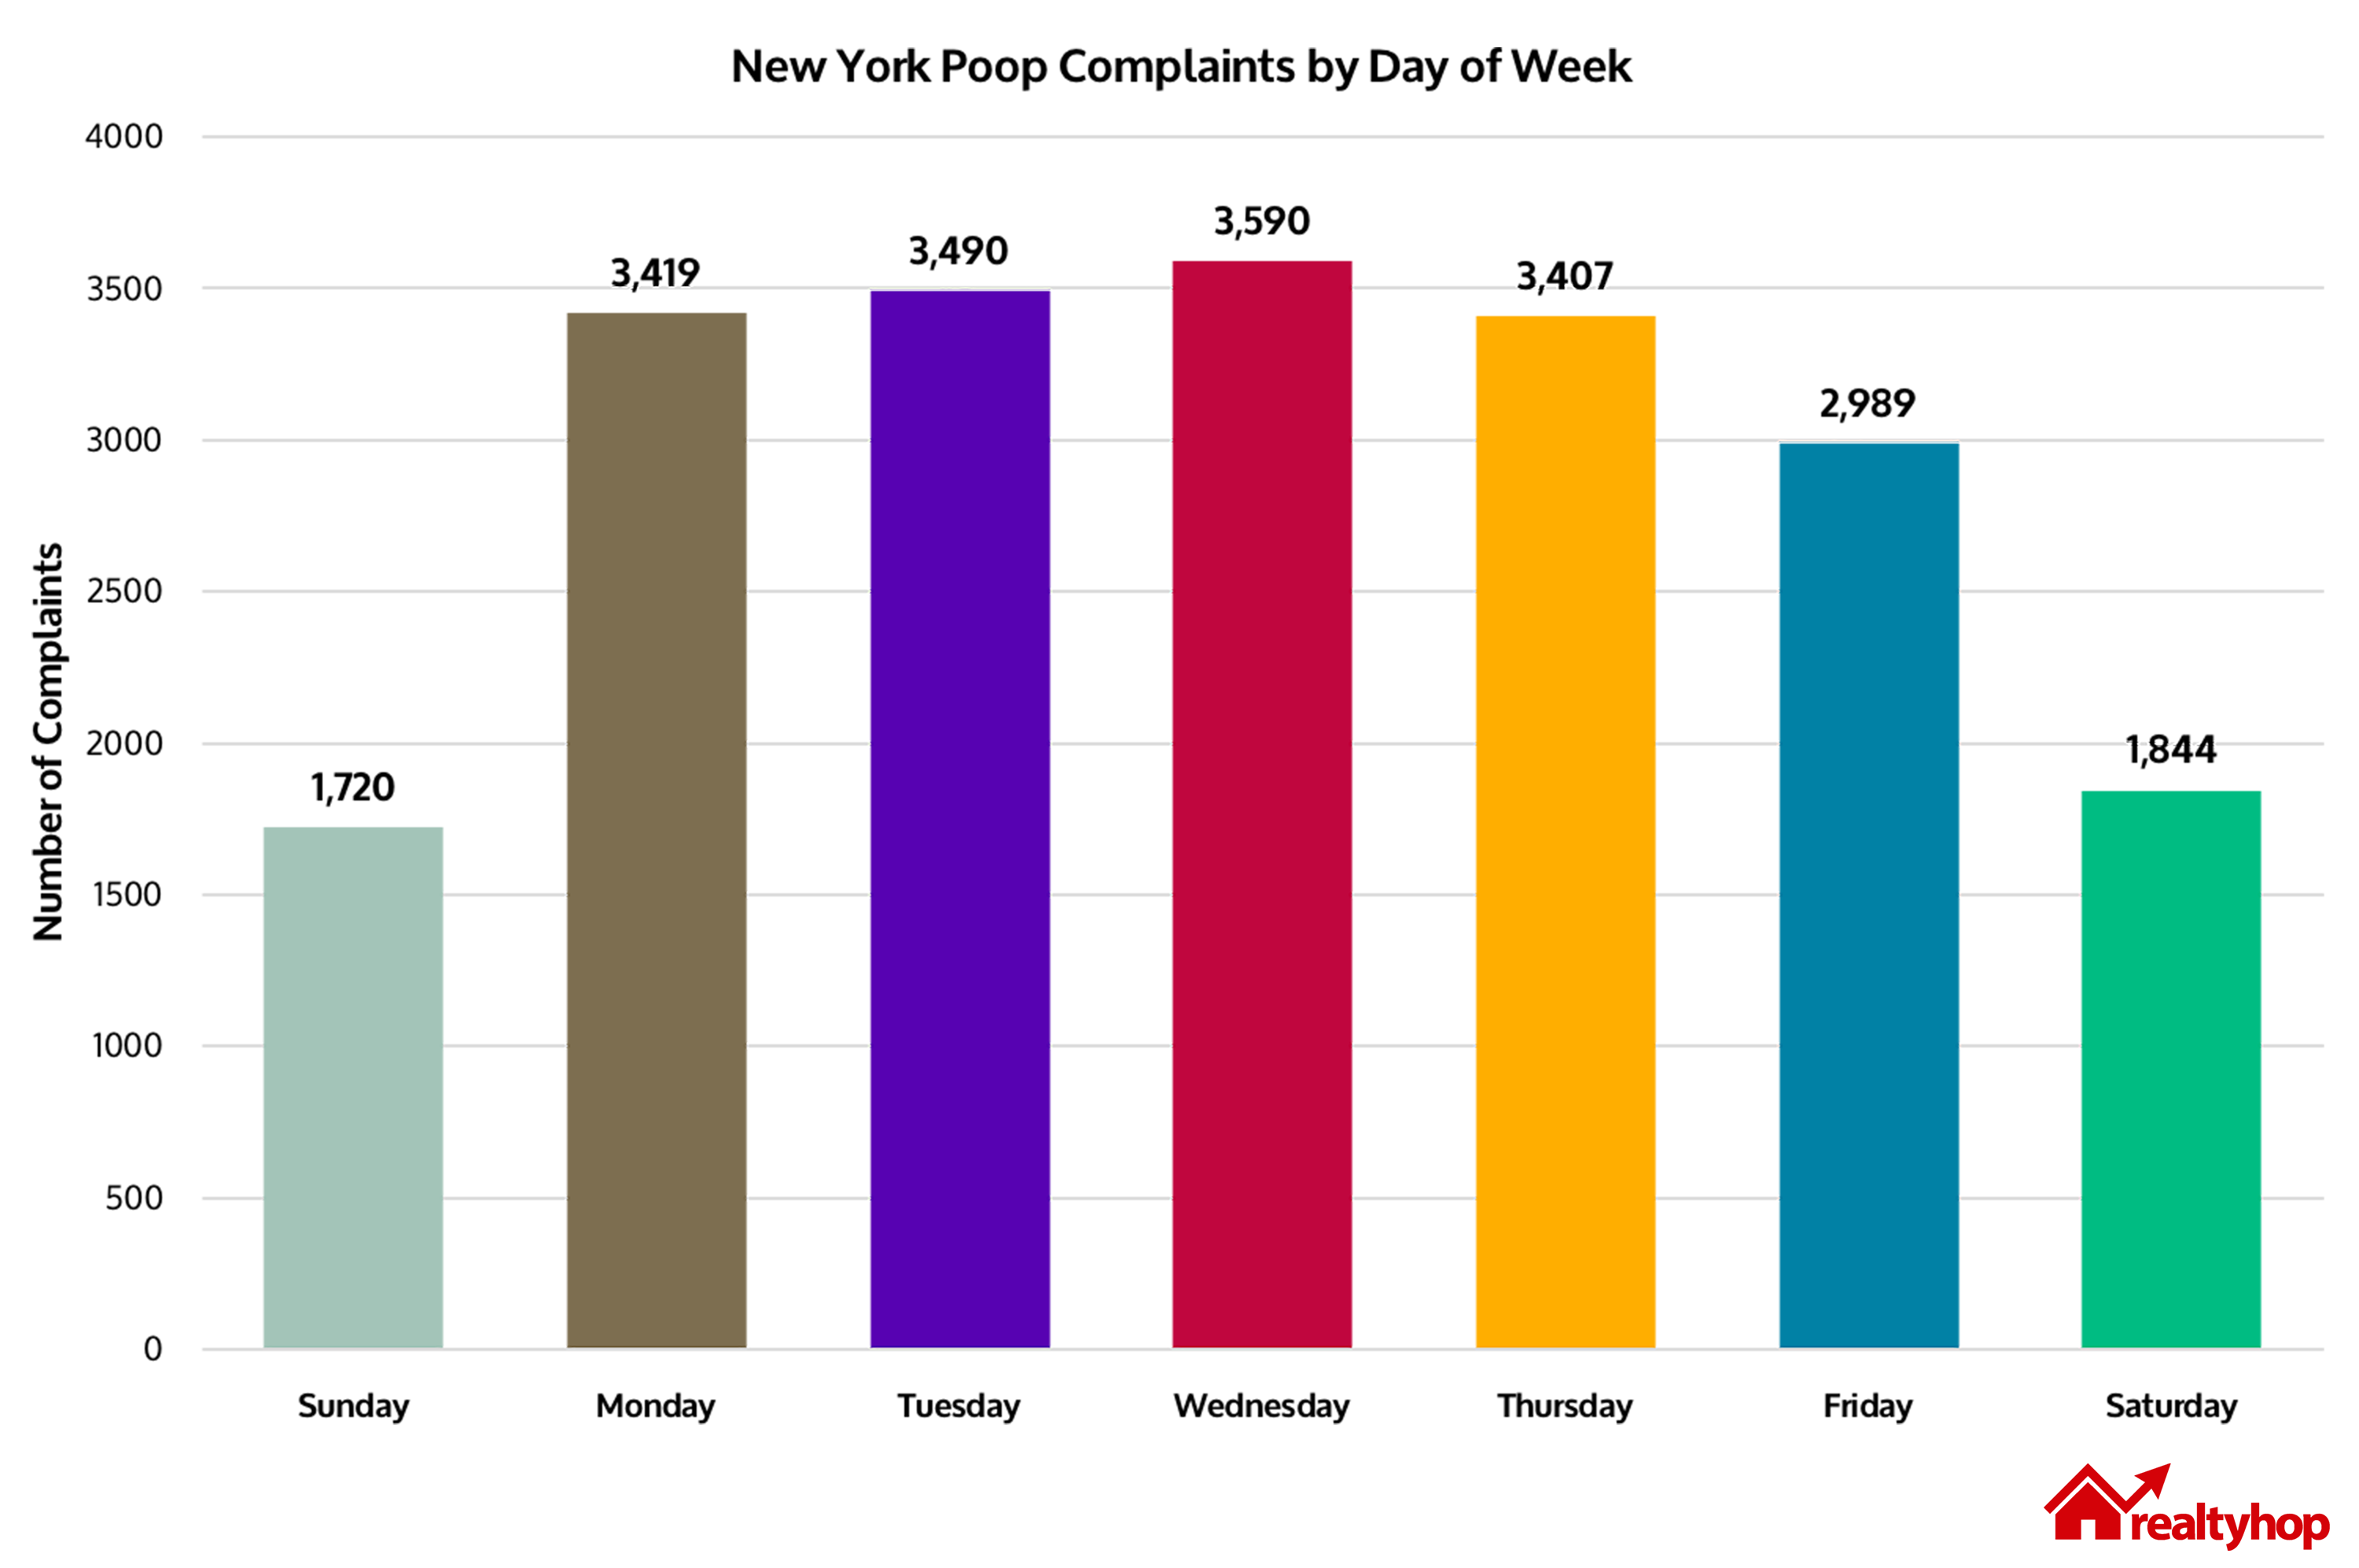
When breaking down the data by day of the week, we noticed that Wednesday (3,590 complaints in total) is the worst day in terms of cleanliness, followed by Tuesday (3,490), and Monday (3,419). People also tend to skip weekends. Could it be that many New Yorkers go out of town on weekends, or could it be that they have more time to pick up poop and clean up the sidewalk?
San Francsico
Oscar Wilde once said, “It’s an odd thing but anyone who disappears is said to be in San Francisco.” Indeed, with the weather, view, and diversity, San Francisco is one of the most beautiful cities in the U.S. But then, every city has a dark side, and San Francisco is no exception. San Francisco, as small as it is, is covered by poop, dog and human poop. According to the San Francisco Department of Animal, there are around 120,000 dogs in San Francisco, making it one of the most dog-friendly cities. In addition to our furry friends, there are over 7,000 homeless individuals in San Francisco. Sounds a lot better than New York and Los Angeles, you might say. But the lack of shelters and a better system is putting the city in danger.
Where to Watch Out
Living in a sh*tty neighborhood has a whole new meaning for San Franciscans. The map below shows the “poop-ness” of neighborhoods in San Francisco. Unlike what we saw in Chicago and New York, the city center of San Francisco is, sadly, covered by poop, and neighborhoods away from the city center see fewer complaints (except for Golden Gate Park).
These are the Dirtiest Neighborhoods
- Golden Gate Park – 3218.75 Average Yearly Complaints/Per 10,000 Households – 23 complaints in 2017, 28 complaints in 2018 as of Aug 31st.
- South of Market – 2492.90 Average Yearly Complaints/Per 10,000 Households – 4,436 complaints in 2017, 3,782 complaints in 2018 as of Aug 31st.
- Tenderloin – 2272.61 Average Yearly Complaints/Per 10,000 Households – 4,035 complaints in 2017, 2,211 complaints in 2018 as of Aug 31st.
These are the Cleanest Neighborhoods
- Presidio Heights – 13.32 Average Yearly Complaints/Per 10,000 Households – 17 complaints in 2017, 14 complaints in 2018 as of Aug 31st.
- Twin Peaks – 18.37 Average Yearly Complaints/Per 10,000 Households – 9 complaints in 2017, 10 complaints in 2018 as of Aug 31st.
- Lakeshore – 19.21 Average Yearly Complaints/Per 10,000 Households – 19 complaints in 2017, 22 complaints in 2018 as of Aug 31st.
There Is No Correlation Between Median Home Value and Poop in San Francisco
While one would assume that lower-income neighborhoods might experience worse poop issues, that is not the case in San Francisco. There is, in fact, no correlation between median home value and poop. In other words, there is no patterns or trends when we compared median home value and the number of poop complaints within a zip code. Nor did we find any patterns when comparing homeownership with poop complaints by neighborhood. It seems that the poop crisis in San Francisco is unlike what we see in other cities (where you can just blame it on the cute furry little friends of ours), it reflects more so a social crisis. Indeed, there are over 120,000 dogs in the Golden City, but the number of unsheltered homeless individuals is the real cause behind it (they can easily travel in between zip codes and neighborhoods).
Is the Poop Crisis Getting Worse in San Francisco?
Yes, yes, yes. Figure 13 shows the number of unique poop complaints every year from 2011 to 2018, and the number almost tripled, from 5,606 complaints in 2011 to 20,899 complaints in 2017, making San Francisco the doo-doo capital of the U.S. As of August 31st, we have seen 16,319 complaints in 2018, and it is quite possible that San Francisco will once again break the record if the amount of waste continues at its current pace. Is the Poop Patrol going to help?

When to Watch Out
Since San Francisco has the perfect weather, we assumed that we’d see more evenly distributed curves. Figure 14 shows the number of poop complaints by month, and it is just like our assumption, poop complaints are more evenly distributed compared to New York City and Chicago, two cities that both have tough winters and snow. What’s interesting in our finding, however, is that August 2018 marked the worst August in history since 2011. It is no wonder why the city is launching the Poop Patrol program, as the poop crisis has reached a whole new level.

However, we did find the same trend in San Francisco as we did in the other cities when looking at the number of poop complaints by day of the week. Monday has been the worst day, with 17,008 complaints, followed closely by Tuesday, with 16,920 complaints. It seems that like Chicagoans, San Franciscans take a break from calling 311 on weekends, but once Monday comes, all that sh*t has to be gone!

Why Did We Choose Poop?
There is less reliable data on litter density or cleanliness by neighborhood. After all, it takes so little to pick up an empty water bottle than pulling out your phone from your pocket and making a 311 complaint. Poop, however, is dirty and disturbing enough that people actually complain about it. The number of poop complaints, therefore, can be seen as an indication of the cleanliness of neighborhood, or more precisely, the living standards of an area. By looking at 311 poop complaints in different cities and neighborhoods, we had the opportunity to review the society we live in from a different angle. As much as we love that this study is humorous and fun to read, there is one finding we cannot ignore: with affordability being an issue in most urban areas, neighborhoods are more divided. It is the new urban crisis we all need to face.
[1] The 311 data was retrieved from:
- Chicago – https://data.cityofchicago.org/Service-Requests/Chicago-Poop-Complaints/eeph-ivd9
- New York City – https://data.cityofnewyork.us/Social-Services/311-Service-Requests-from-2010-to-Present/erm2-nwe9/data
- San Francisco – https://data.sfgov.org/City-Infrastructure/311-Cases/vw6y-z8j6
[2] The Household data was retrieved from:
- Chicago – https://datahub.cmap.illinois.gov/dataset/2010-census-data-summarized-to-chicago-community-areas/resource/b30b47bf-bb0d-46b6-853b-47270fb7f626
- New York City – https://data.cityofnewyork.us/City-Government/Demographics-and-profiles-at-the-Neighborhood-Tabu/hyuz-tij8
- San Francisco – http://default.sfplanning.org/publications_reports/SF_NGBD_SocioEconomic_Profiles/2010-2014_ACS_Profile_Neighborhoods_v3AH.pdf