
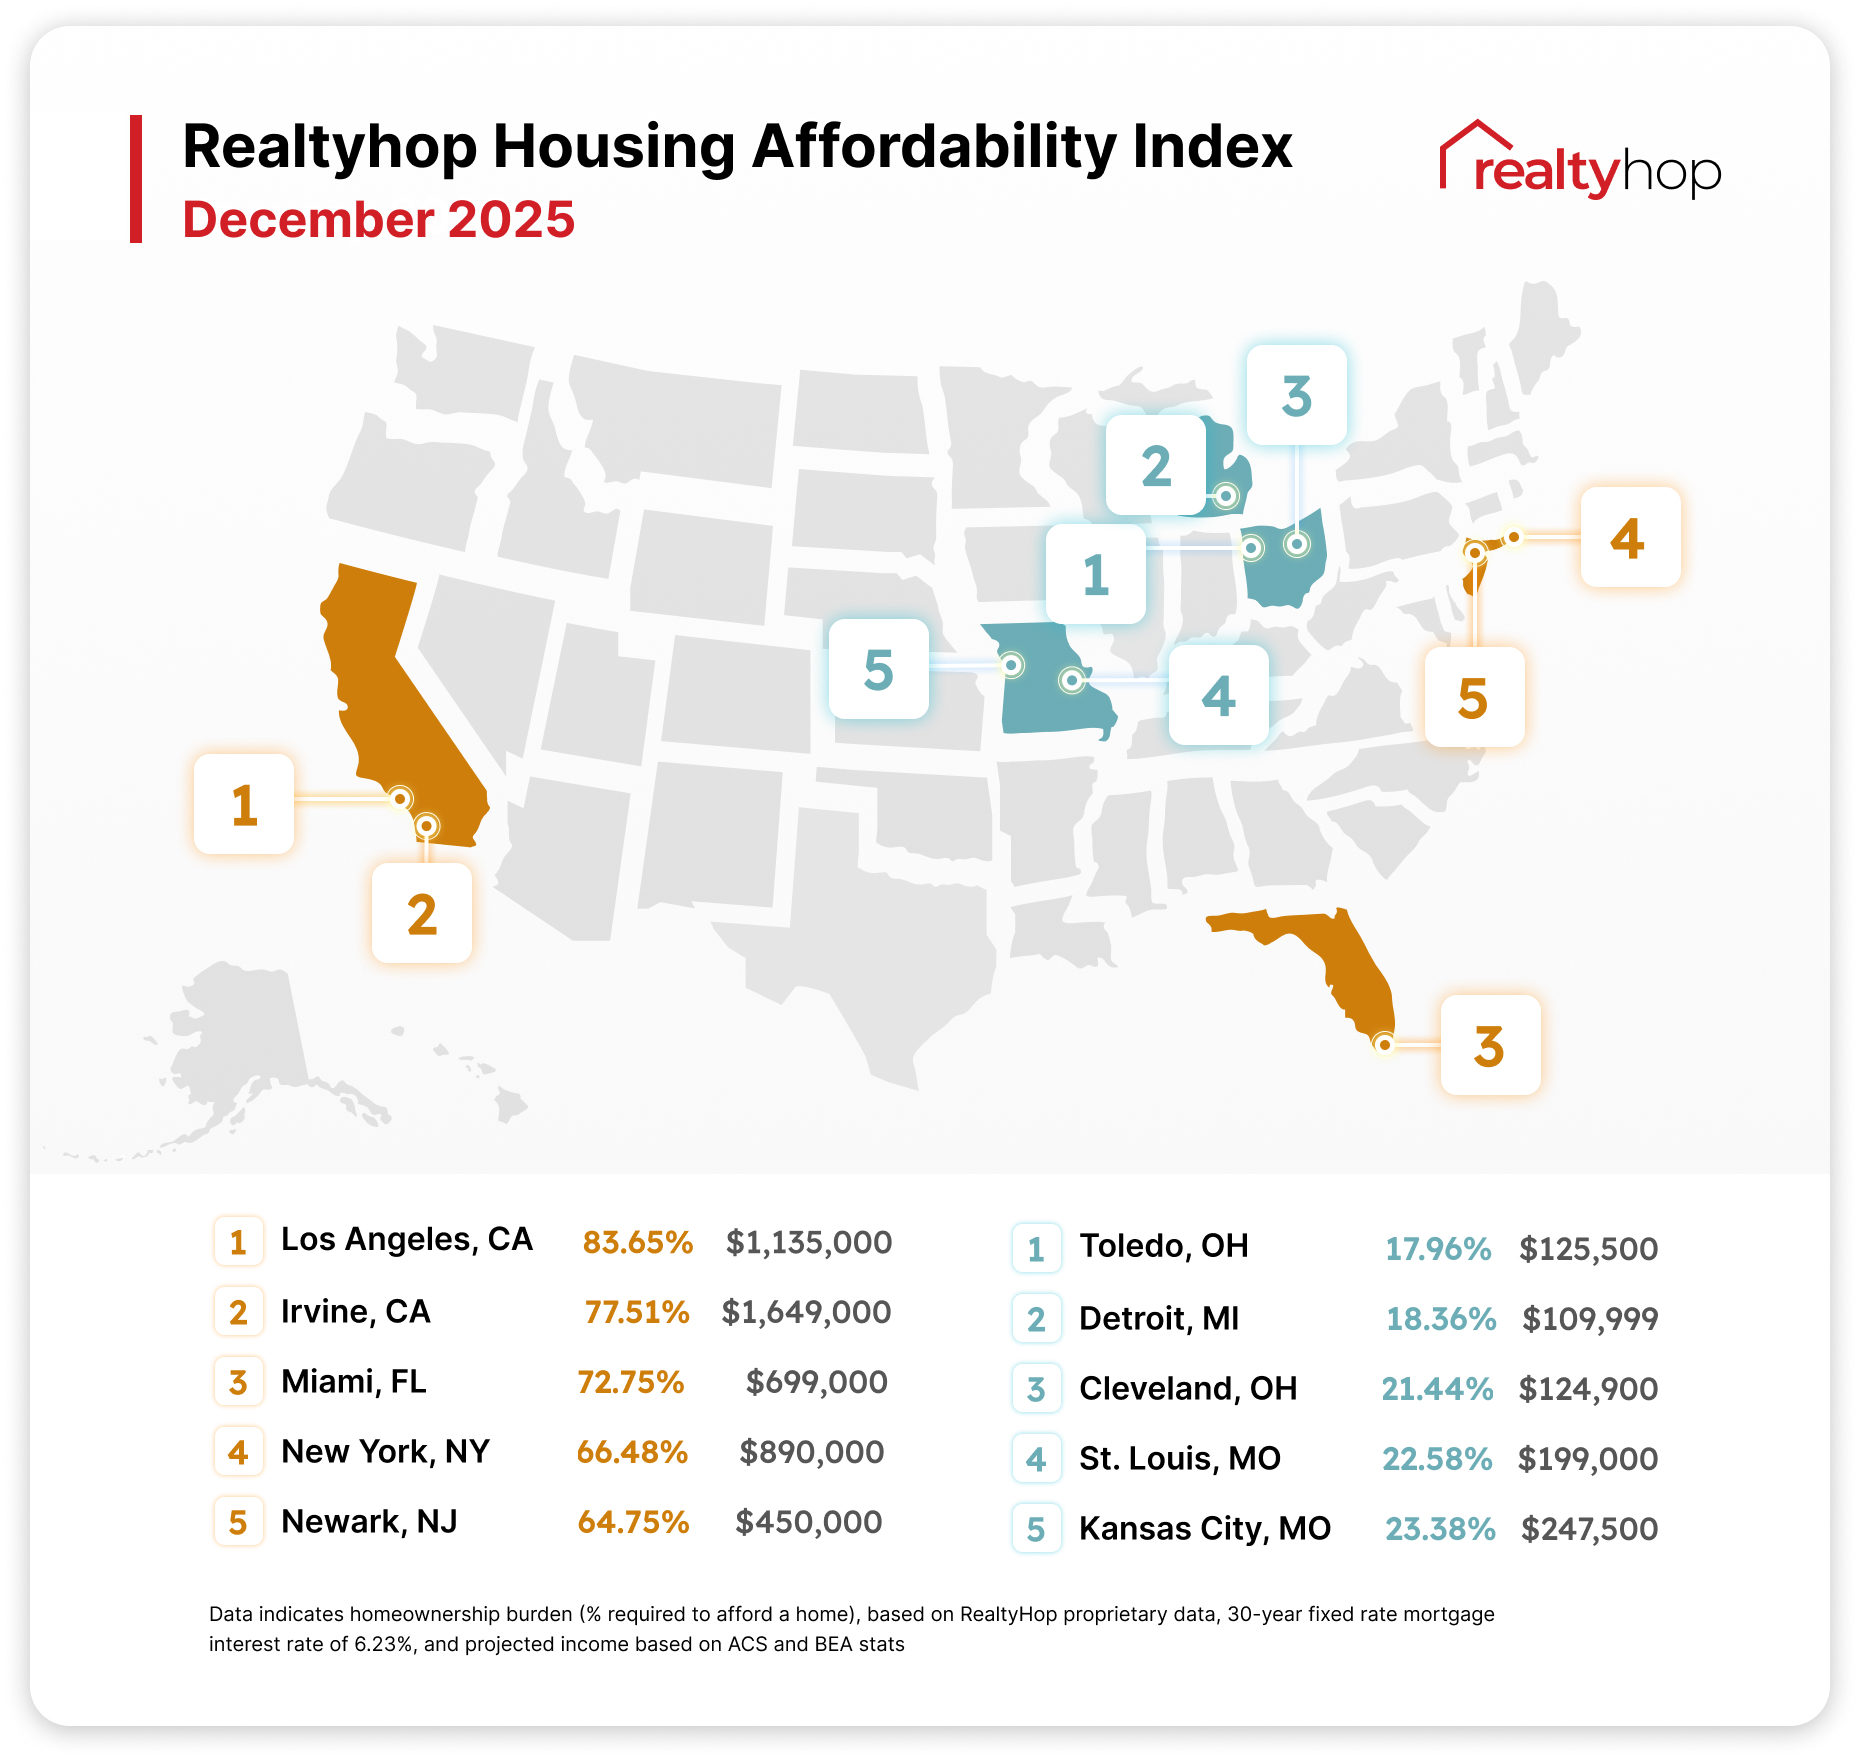
In this December edition of the RealtyHop Housing Affordability Index, we examine what American households across the 100 largest cities need to spend on housing to find out:
Is homeownership affordable, or even possible, for the average American family?
As 2025 comes to an end, inflation remains a factor in contributing to the affordability crisis in America. Even though income growth increased slightly, it did not outpace increases in inflation. The cost of groceries and gasoline continue to rise, with many seeing their insurance premiums to increase in the new year. As always, those thinking about buying should consult with local market experts to understand specific pricing in their area.
Key Findings:
- Households in 67 out of the 100 major cities we analyzed would have to spend over 30% of their annual household income to own a median home in the area.
- For 12 cities in the index, homeowners must spend over 50% of their income on homeownership costs, indicating severe unaffordability.
- This month, Toledo, OH remains the most affordable housing market.
- California remains unaffordable for average Americans. 7 of the 10 least affordable markets are located in California.
- Buyers in Cleveland, OH, Toledo, OH, and Detroit, MI remain the only three cities in the study where monthly homeownership payments sit below $1,000.
The 5 Least Affordable Housing Markets
1. Los Angeles, CA
Los Angeles remains the country’s least affordable housing market. The city saw a slight rise in the share of income needed to be allocated towards housing, and families can now expect to spend $6,180.43 monthly for a home with the median list price of $1,135,000.
2. Irvine, CA
Irvine is the second least affordable U.S. city in our rankings this month. Households with a median income can expect to spend a staggering $9,338.36 each month on mortgage payments and property taxes, equating to 77.51% of the annual household income.
3. Miami, FL
Miami remained the third least affordable housing market this month. Households making the median income of $65,523 will need to spend 72.75% of it in order to own a home.
4. New York, NY
New York City held onto its spot as the fourth least affordable city, with the list price of $890,000. Potential buyers should expect to spend $4,872.19 monthly on homeownership costs.
5. Newark, NJ
Newark remained steady as the fifth least affordable housing market. With a median list price of $450,000, an average family in Newark should expect to direct 64.75% of their income towards owning.
The 5 Most Affordable Housing Markets
1. Toledo, OH
Toledo continues to rank as the most affordable city in the U.S. Local families making the median income of $52,441 should expect to spend $784.85 on their monthly mortgage payments and property taxes.
2. Detroit, MI
Detroit remains one of the most affordable housing markets in the country. With a median list price of $109,999, households only need to allocate $668.16 a month on homeownership expenses.
3. Cleveland, OH
Cleveland is the third most affordable housing market this month. Prospective buyers need to spend 21.44% of their income on homeownership costs. Out of the top five most affordable cities in our index, Cleveland saw the biggest increase in affordability this month as the median home price decreased 0.51% to $124,900.
4. St. Louis, MO
St. Louis held onto its spot in the rankings as the fourth most affordable housing market. Homeowners would need to direct 22.58% of their income towards owning a home with the median price of $199,000.
5. Kansas City, MO
Kansas City remains the fifth most affordable housing market. The median list price sits at $247,500 and households can now expect to spend $1,450.08 monthly on mortgage payments and property taxes.
Housing Markets to Watch
The following housing markets witnessed significant changes this month:
Memphis, TN
Memphis ranks 87th on our list, down 4 spots from last month. Single-Family Listings are up 17.6% from last year, which has created a stronger negotiating position for buyers. With the median household income being $56,499 and the monthly estimated mortgage payment being $1,220.33, homeowners in Memphis can expect to spend 25.92% of their income on owning a home.
Buffalo, NY
Buffalo homebuyers can expect to spend more money this month on housing, with monthly costs at around $1,155.26, a 1.81% increase in the share of income needed to be allocated to homeownership costs since last month. It is worth noting that Buffalo residents may soon find it harder to cover their monthly mortgage, taxes, and insurance cost, as the New York State Public Service Commission has approved rate hikes for both National Grid and National Fuel.
Denver, CO
Housing affordability improved in Denver, making it the 36th least affordable market in the country, 4 spots better than last month. The median home price decreased 2.79% to $580,000, and local families would have to spend 36.54% of their annual household income on housing. Archways Communities is in the final stages of converting two former Johnson and Wales residence halls into 58 apartments.
Methodology
The RealtyHop Housing Affordability Index analyzes proprietary and ACS Census data to provide an index of housing affordability and homeownership burden across the 100 most populous cities in the country. Median home prices are calculated using over 800,000 listings in the RealtyHop database over the month before publication.
To calculate the index, the following statistics are used:
1) Projected median household income based on Census ACS and BEA data
2) Median for-sale home listing prices via RealtyHop data
3) Local property taxes via ACS Census data
4) Mortgage expenses, assuming a 30-year mortgage, a 6.23% mortgage interest rate based on reported weekly averages in the past four weeks, and a 20% down payment.
See below for previous RealtyHop Housing Affordability Studies:
