
In the below analysis, we break down acquisition price, aggregate yearly rent, operating costs, and the NOI involved in our index calculations. To research capitalization rates and other statistics for specific properties, refer to RealtyHop’s comprehensive for-sale listing search for every city across the country.
Residential Cap Rates by U.S. City
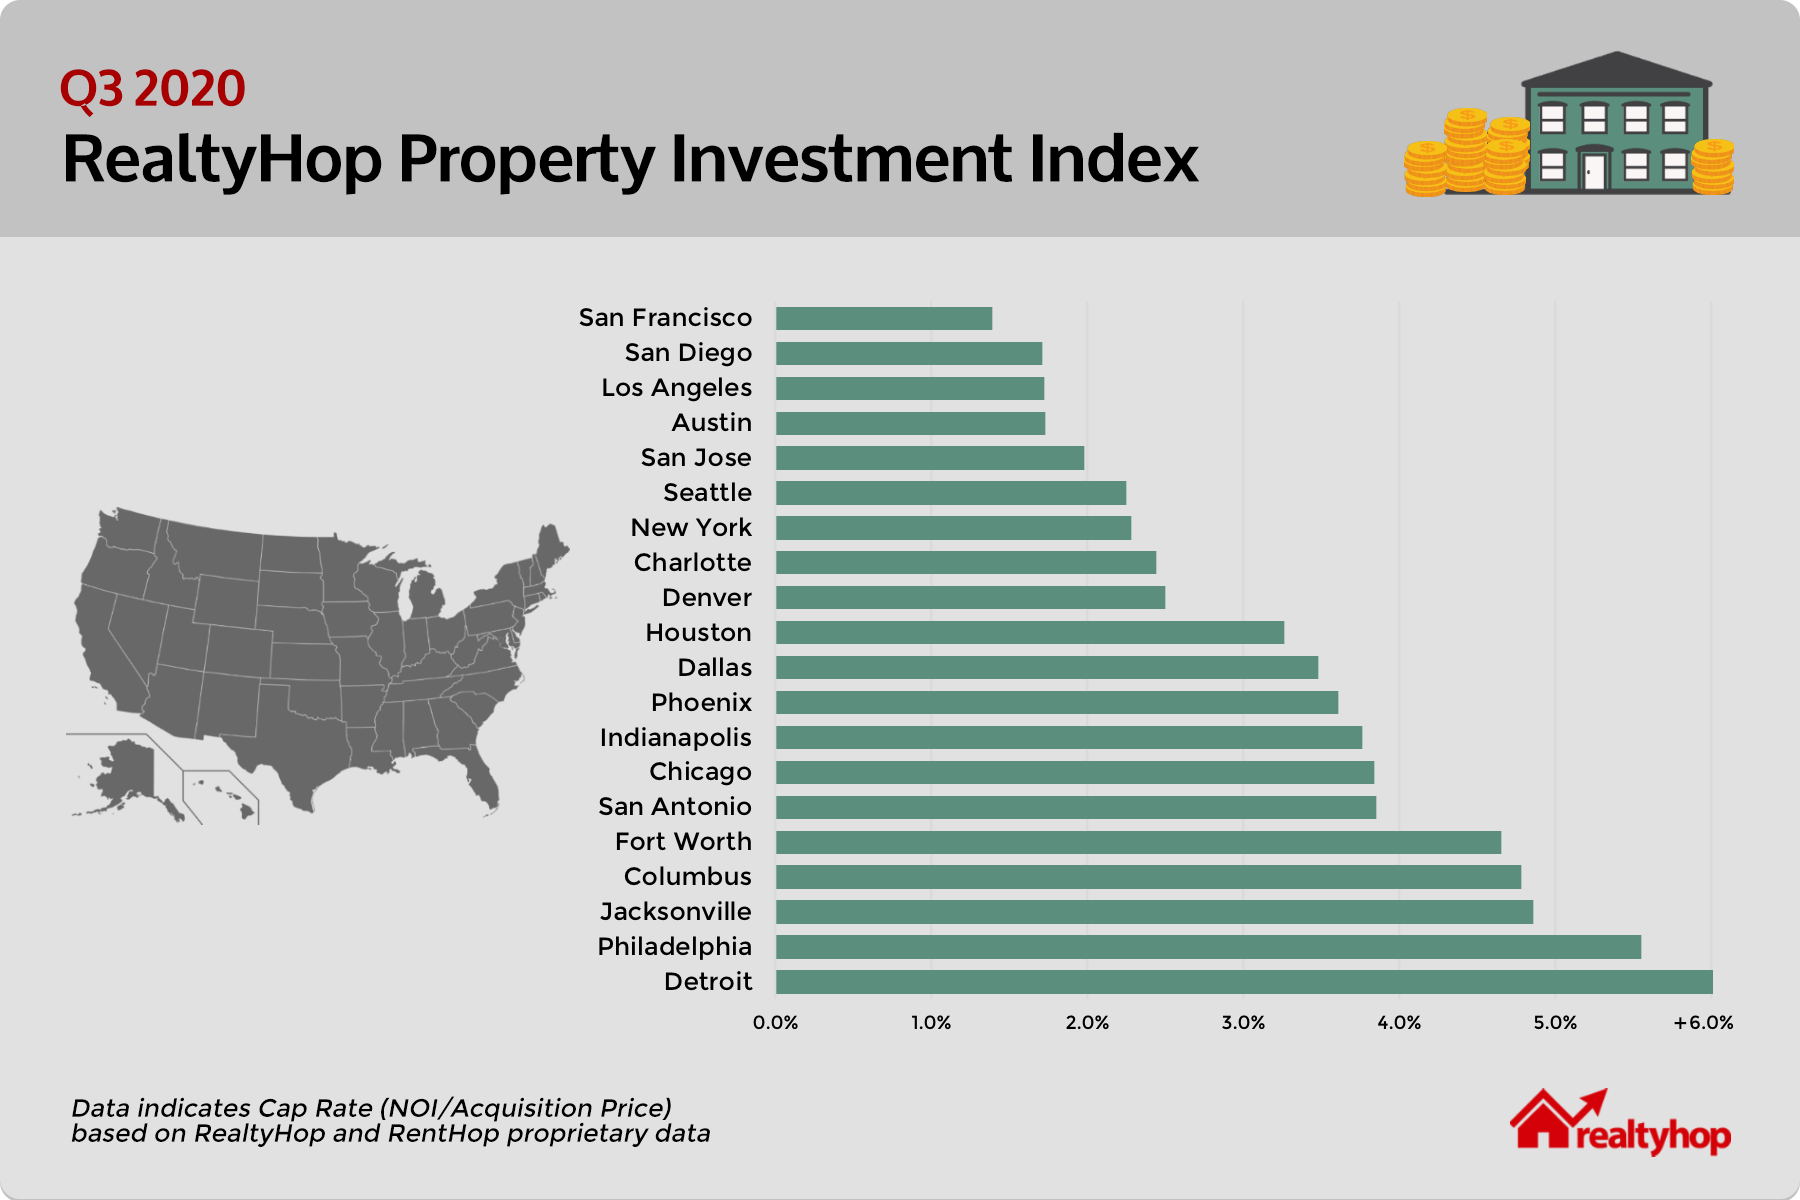
The below table details capitalization rates across the 20 largest markets by population.

August Real Estate Market Trends
Averages and Statistics
This August, the average capitalization rate across the 100 cities in our index was 3.61%, an increase from the 3.35% seen in last quarter’s report. Detroit saw the highest cap rate at 14.39%, while San Francisco saw the lowest at 1.39%. The average property tax rate of all 100 cities was 1.14%.

1. Detroit, MI – 14.39%
Detroit had the highest capitalization rate of any city in the U.S at 14.39%. Rent prices increased to a median of $852 per month across all listings, compared with $783 last report. Despite rent prices rising, the city’s cap rate was tempered by an increase in real estate prices to $57,500.
2. Cleveland, OH – 8.51%
Cleveland saw the second highest capitalization rate of any city at 8.51%. The city’s rate remained stable over the quarter, due to increases in both real estate prices, at a median of $92,000, as well as rent prices to $856 per month.
3. New Orleans, Louisiana – 7.24%
New Orleans jumped two spots to take the third highest city, with it’s capitalization rate increasing to 7.24% from 5.76% last report. The change was due to a hike in rent prices to $1,449 per month. New Orleans has the lowest property taxes of any city in the top fifteen at 0.80%.
4. Baltimore, Maryland – 6.42%
Baltimore saw its capitalization rate increase from 6.12% to 6.42% this report. This change was due to rent prices rising to $1,341 per month. The median real estate value in Baltimore over the past quarter was $180,000.
5. Buffalo, NY – 6.26%
Buffalo saw the fifth highest capitalization rate of any city at 6.26%, an increase of one spot since our last report. Real estate prices had a median of $138,250, while rent prices were $1,007 per month.

1. San Francisco, CA – 1.39%
San Francisco again had the lowest capitalization rate of any city in the U.S. at 1.39%. This was a sizable drop from our last report, as rent prices in the Bay Area have fallen dramatically due to the pandemic. Acquisition prices for properties increased slightly to a median of $1.475M. Despite the city’s low cap rate, occupancy in the Bay Area remains one of the strongest across the country.
2. Fremont, CA – 1.50%
Capitalization rates in Fremont also dropped over the quarter, led by an increase in real estate prices to a median of $1.05M. Rent prices remained stable at $2,833 per month.
3. Jersey City, NJ – 1.54%
Jersey City’s capitalization rate continued to slide over the past quarter, decreasing from 1.70% to 1.54%. The change was due to an increase in for-sale prices to $645,000, up from $625,000 last report. Rent prices remained flat at $2,333 per month.
4. San Diego, CA – 1.71%
San Diego has the fourth lowest capitalization rate in the country at 1.71%, a slight decrease from 1.80% in our last report. While rents remained stable at $2,100 per month, home prices increased to $735,000 from $715,000.
5. Los Angeles, CA – 1.72%
While still having one of the lowest statistics, Los Angeles saw a slight increase in its cap rate to 1.72%, up from 1.68% last quarter. This change was due to a hike in rent prices to $2,600 per month.
Methodology
To compile the RealtyHop Property Investment Index, the following statistics were used:
1) Median Household Income: Taken from the U.S. Census ACS
2) Population: By city, taken from the U.S. Census ACS
3) Median Home Price: Drawn from RealtyHop’s database of over 300,000 properties for sale in the month prior to publication
4) Median Yearly Rent: Yearly rental income for the trailing 12 months, drawn from RentHop proprietary data (a RealtyHop affiliated company).
5) Maintenance Costs: Annual maintenance costs for a rental property, equal to 1 percent of the total property price per year
6) Tax Rate/Yearly Taxes: Effective tax rate via U.S. Census data
7) Net Operating Income (NOI): Annual net operating income. Calculated by: Aggregate Yearly Rent – Taxes – Maintenance Costs
8) Capitalization Rate: NOI over Median Home Price
Full Dataset
Limitations
While comprehensive, the RealtyHop Property Investment Index does not take into account occupancy rates and time on market statistics. In theory, markets that suffer from net negative migration, and consequently lower rental demand, may see capitalization rates skew higher.
For example, while Detroit has the highest capitalization rate of any city by a large margin, investors there may potentially see lower occupancy rates and longer times on market, thus lowering aggregate yearly rent and NOI. Conversely, popular cities with lower cap rates such as San Francisco, Los Angeles, and New York are likely to see high rental demand, and therefore stronger occupancy statistics.
Financial Disclaimer: The statistics provided in the RealtyHop Property Investment Index should be used for informational purposes only. Before making any investment decision, speak with a professional advisor, property manager, or local real estate company to verify the information listed in this report.