
We specifically focused on neighborhoods with the highest total number of price drops, specifically the highest price drops by median percentage, median dollar value, and by street address.
A Closer Look at NYC’s Neighborhoods
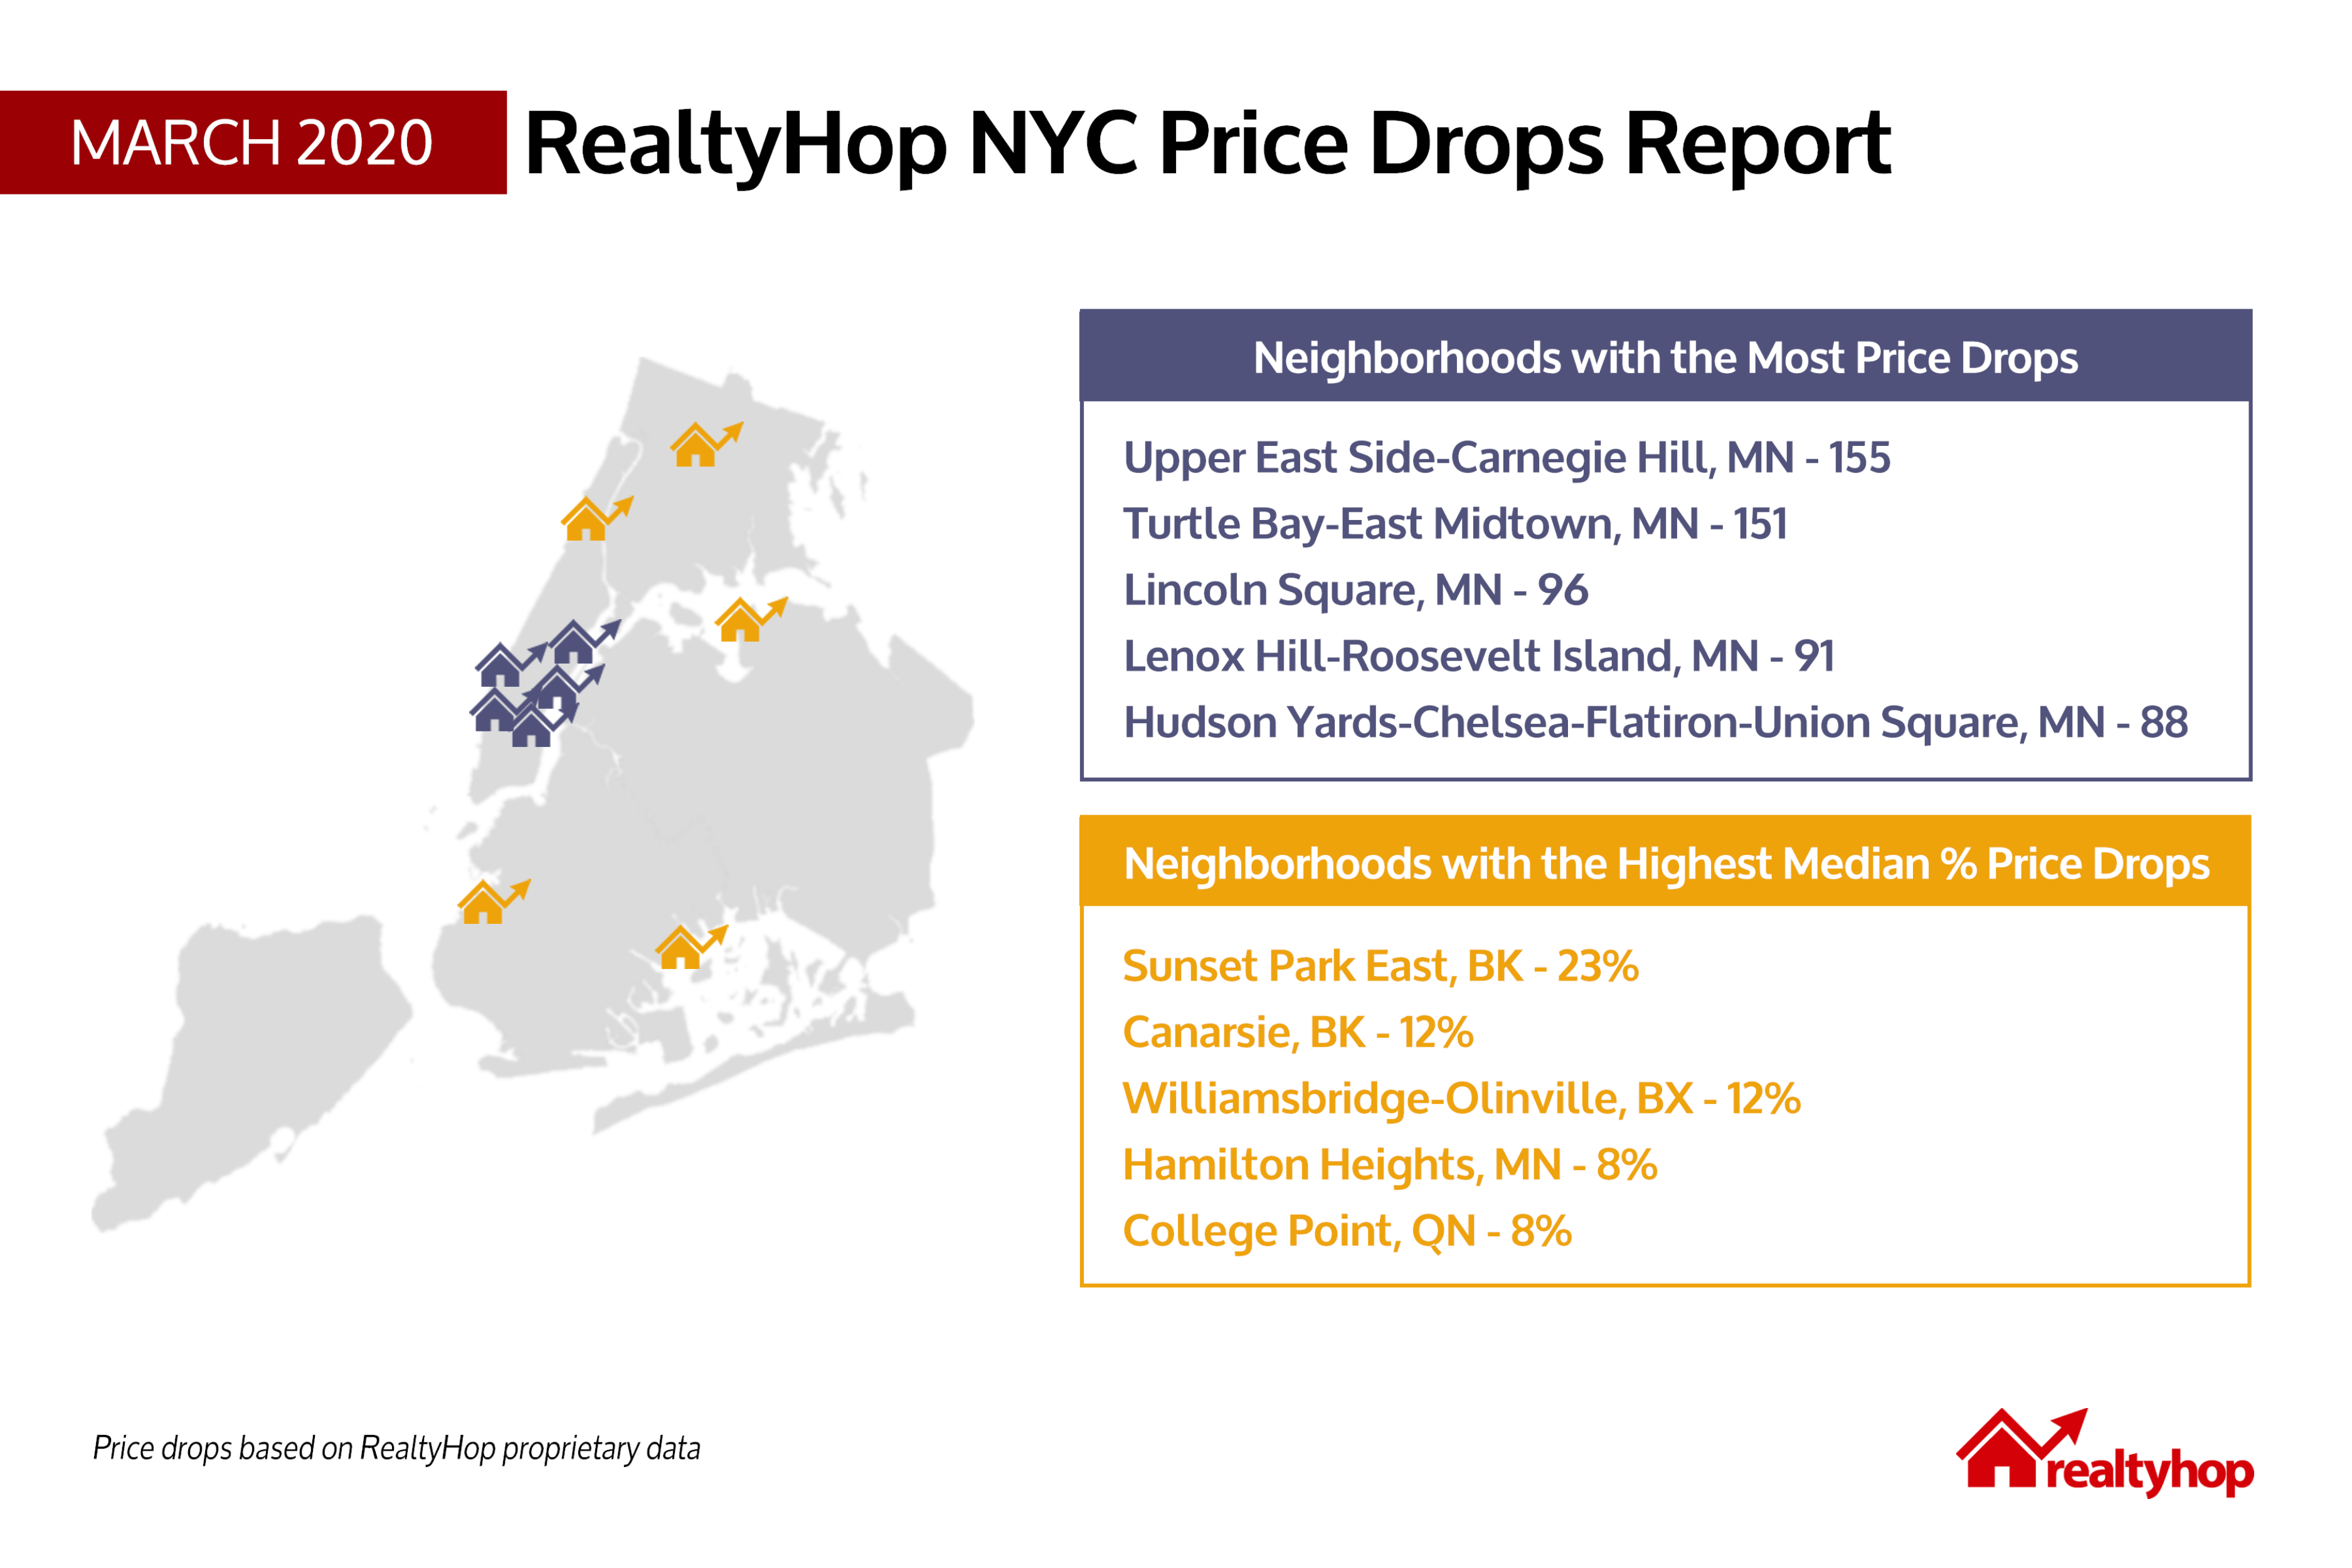
Our interactive map below depicts the neighborhoods we analyzed. All numbers are based on RealtyHop’s proprietary dataset.
Top 5 Neighborhoods With the Highest Number of Price Drops
| Neighborhood | Borough | Number of Price Drops | |
| 1 | Upper East Side-Carnegie Hill | Manhattan | 155 |
| 2 | Turtle Bay-East Midtown | Manhattan | 151 |
| 3 | Lincoln Square | Manhattan | 96 |
| 4 | Lenox Hill-Roosevelt Island | Manhattan | 91 |
| 5 | Hudson Yards-Chelsea-Flatiron_Union Square | Manhattan | 88 |
Top 5 Neighborhoods With the Highest Median Percentage Price Drops
| Neighborhood | Borough | Median % Price Drops | |
| 1 | Sunset Park East | Brooklyn | -23% (-$305,000) |
| 2 | Canarsie | Brooklyn | -12% (-$92,500) |
| 3 | Williamsbridge-Olinville | Bronx | -12% (-$15,000) |
| 4 | Hamilton Heights | Manhattan | -8% (-$49,000) |
| 5 | College Point | Queens | -8% (-$49,000) |
Top 5 Neighborhoods With the Highest Median Dollar Price Drops
| Neighborhood | Borough | Median $ Price Drops | |
| 1 | Sunset Park East | Brooklyn | -$305,000 (-23%) |
| 2 | SoHo-TriBeCa-Civic Center-Little Italy | Manhattan | -$205,000 (-5%) |
| 3 | Morrisania-Melrose | Bronx | -$200,000 (-5%) |
| 4 | Homecrest | Brooklyn | -$200,000 (-5%) |
| 5 | Hunts Point | Bronx | -$200,000 (-5%) |
Top 5 Addresses with the Highest Percentage Price Drop in February (Still on the Market)
| Address | Current Price | Recent % Price Drops | |
| 1 | 503 W 24th St, Manhattan, 10001 | $14,875,100 | -23.7% (-$4,624,900) |
| 2 | 425 E 58th St, Manhattan, 10022 | $1,300,000 | -23.3% (-$395,000) |
| 3 | 172 Madison Ave, Manhattan, 10016 | $76,000,000 | -22.4% (-$22,000,000) |
| 4 | 838 Greenwich St, Manhattan, 10014 | $450,000 | -21.1% (-$120,000) |
| 5 | 3614 Johnson Ave, Bronx, 10463 | $475,000 | -20.8% (-$124,999) |
Top 5 Addresses with the Highest Dollar Price Drop in February (Still on the Market)
| Address | Current Price | Recent $ Price Drops | |
| 1 | 172 Madison Ave, Manhattan, 10016 | $76,000,000 | -$22,000,000 (-22.4%) |
| 2 | 503 W 24th St, Manhattan, 10001 | $14,875,100 | -$4,624,900 (-23.7%) |
| 3 | 80 Columbus Cir, Manhattan, 10023 | $25,000,000 | -$4,000,000 (-13.8%) |
| 4 | 25 Columbus Cir, Manhattan, 10019 | $26,995,000 | -$3,000,000 (-10%) |
| 5 | 145 Central Park W, Manhattan, 10023 | $22,750,000 | -$2,250,000 (-9%) |
Full Dataset
The intractive table below includes all NYC listings with price drops in the month of February. You can sort by column or do a quick search using the search bar.
Methodology
The New York City Price Drop report is a monthly report that analyzes proprietary data from RealtyHop to map price drops for listings in New York City. The dataset analyzed is taken from the month prior to publication and includes all five boroughs of New York City, given sufficient data.
Want to know who owns these listings? Check it out for yourself on our site by using our New York Property Records Search.