In our first ever RealtyHop Housing Affordability Index, we investigate the issue of housing affordability across the United States. Is the “American Dream” of buying a home still attainable for the average citizen? We analyzed over 300,000 for-sale housing listings on RealtyHop in January 2019, alongside American Community Survey Census data, to answer this question. Using this dataset, we calculated the median cost of owning a home in an area, given local mortgage and property tax rates, and compared that with median income. The result was a comprehensive index of housing affordability for the 100 most populous cities across the country.

The 5 Least Affordable Housing Markets
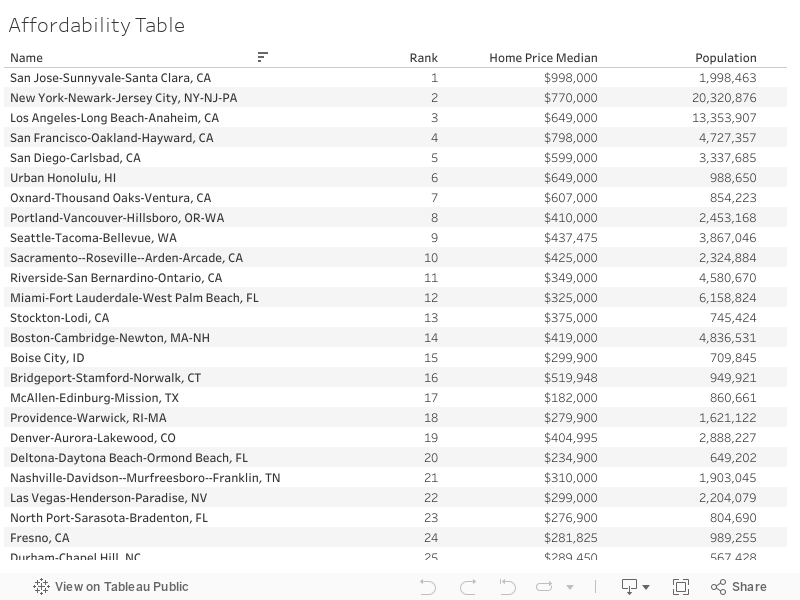
1. San Jose, CA and its surrounding cities was the least affordable metro area in the United States to buy a home. The average resident who decides to purchase a home can expect to spend over 60% of their annual income on housing costs. Despite having the second highest annual income of any metro area (behind Stamford, CT) San Jose suffers from the highest home prices in the country, coupled with high property taxes.
2. New York City, NY saw the second highest homeownership burden in the country, with over 54% of median annual household income allocated towards housing costs. Despite high income, New Yorkers were faced with very high housing costs as well as property taxes.
3. Los Angeles, CA residents should expect to shell out 52% of their median annual income for housing costs. High mortgage and property taxes contributed to the third least affordable housing market in the U.S.
4. San Francisco, CA is well publicized to have major housing issues, particularly on the rental front. Purchasing a home was no different, with the SF Bay Area (including Oakland and Hayward) placing fourth on our list. The average resident can expect to spend over 51% of their income on mortgage and property taxes. This is despite having some of the highest salaries anywhere in the country.
5. San Diego, CA rounds out the top five, with the average resident who purchases a home paying upwards of 49% of their annual income on housing costs. Notably, four out of the top five most housing burdened cities are located in California.
The 5 Most Affordable Housing Markets
1. Scranton, PA was the most affordable housing market in the country this February, with the average resident paying only 14.56% of their annual income on housing costs. Scranton benefitted from a low median housing price, as well as decent income rates.
2. Wichita, KS benefits from strong median incomes of over $56,000, alongside a median home price last month of only $137,250. With mortgage and property taxes, residents can expect to only pay about 15% of annual income toward housing costs.
3. Little Rock, AR came in as the third most affordable housing metro area in the U.S., with residents paying only 15.5% of income towards mortgage and property taxes.
4. Dayton, OH real estate was affordable this January, with a median home price of $118,500. Given a strong median annual income of about $52,000, residents can only expect to pay 15.8% of income towards housing costs.
5. Jackson, MS was the fifth most affordable, and therefore least burdened housing market in the country. The average resident can expect to pay about 16% of annual income toward costs when owning a home.
Other Interesting Statistics
- 8 of the top 15 least affordable housing markets were located in California.
- Residents who live in major metro areas in California can expect to pay 30-60% of their annual income toward costs involved in home ownership.
- Honolulu, HI was the sixth most burdened housing market due to high home prices last month. A strong median annual income of $80,000 wasn’t enough to offset this.
- The state of Florida had 5 cities make the top 30 least affordable metro areas. This included Miami, Dayton Beach, Sarasota/Bradenton, Orlando, and Palm Bay.
Methodology
The RealtyHop Housing Affordability Index analyzes both proprietary and ACS Census data to provide an index of housing affordability and homeownership burden across the 100 most populous Metropolitan Areas in the country as defined by the U.S. Census. Median home prices are calculated using hundreds of thousands of active listings in the RealtyHop database over the month prior to publication.
To calculate the index, the following statistics were derived: 1) median for-sale home listing prices, 2) median household incomes using ACS data, 3) estimated property tax burden of a resident via ACS Census data, and 4) mortgage expenses assuming a 30 year mortgage, 4.5% interest rate, and 20% down payment.
Lastly, we calculate the percentage of income by taking the mortgage + tax expense and comparing that to the median household income in a given metropolitan area.
Full Dataset