
In this April installment of the RealtyHop Housing Affordability Index, we investigate the decision to purchase a home in the 100 most populous cities across America. Is homeownership affordable or even possible for the average family in each city? Every month we analyze proprietary RealtyHop data alongside comprehensive U.S. Census data to find out. See how your city fares in affordability.
The 5 Least Affordable Housing Markets
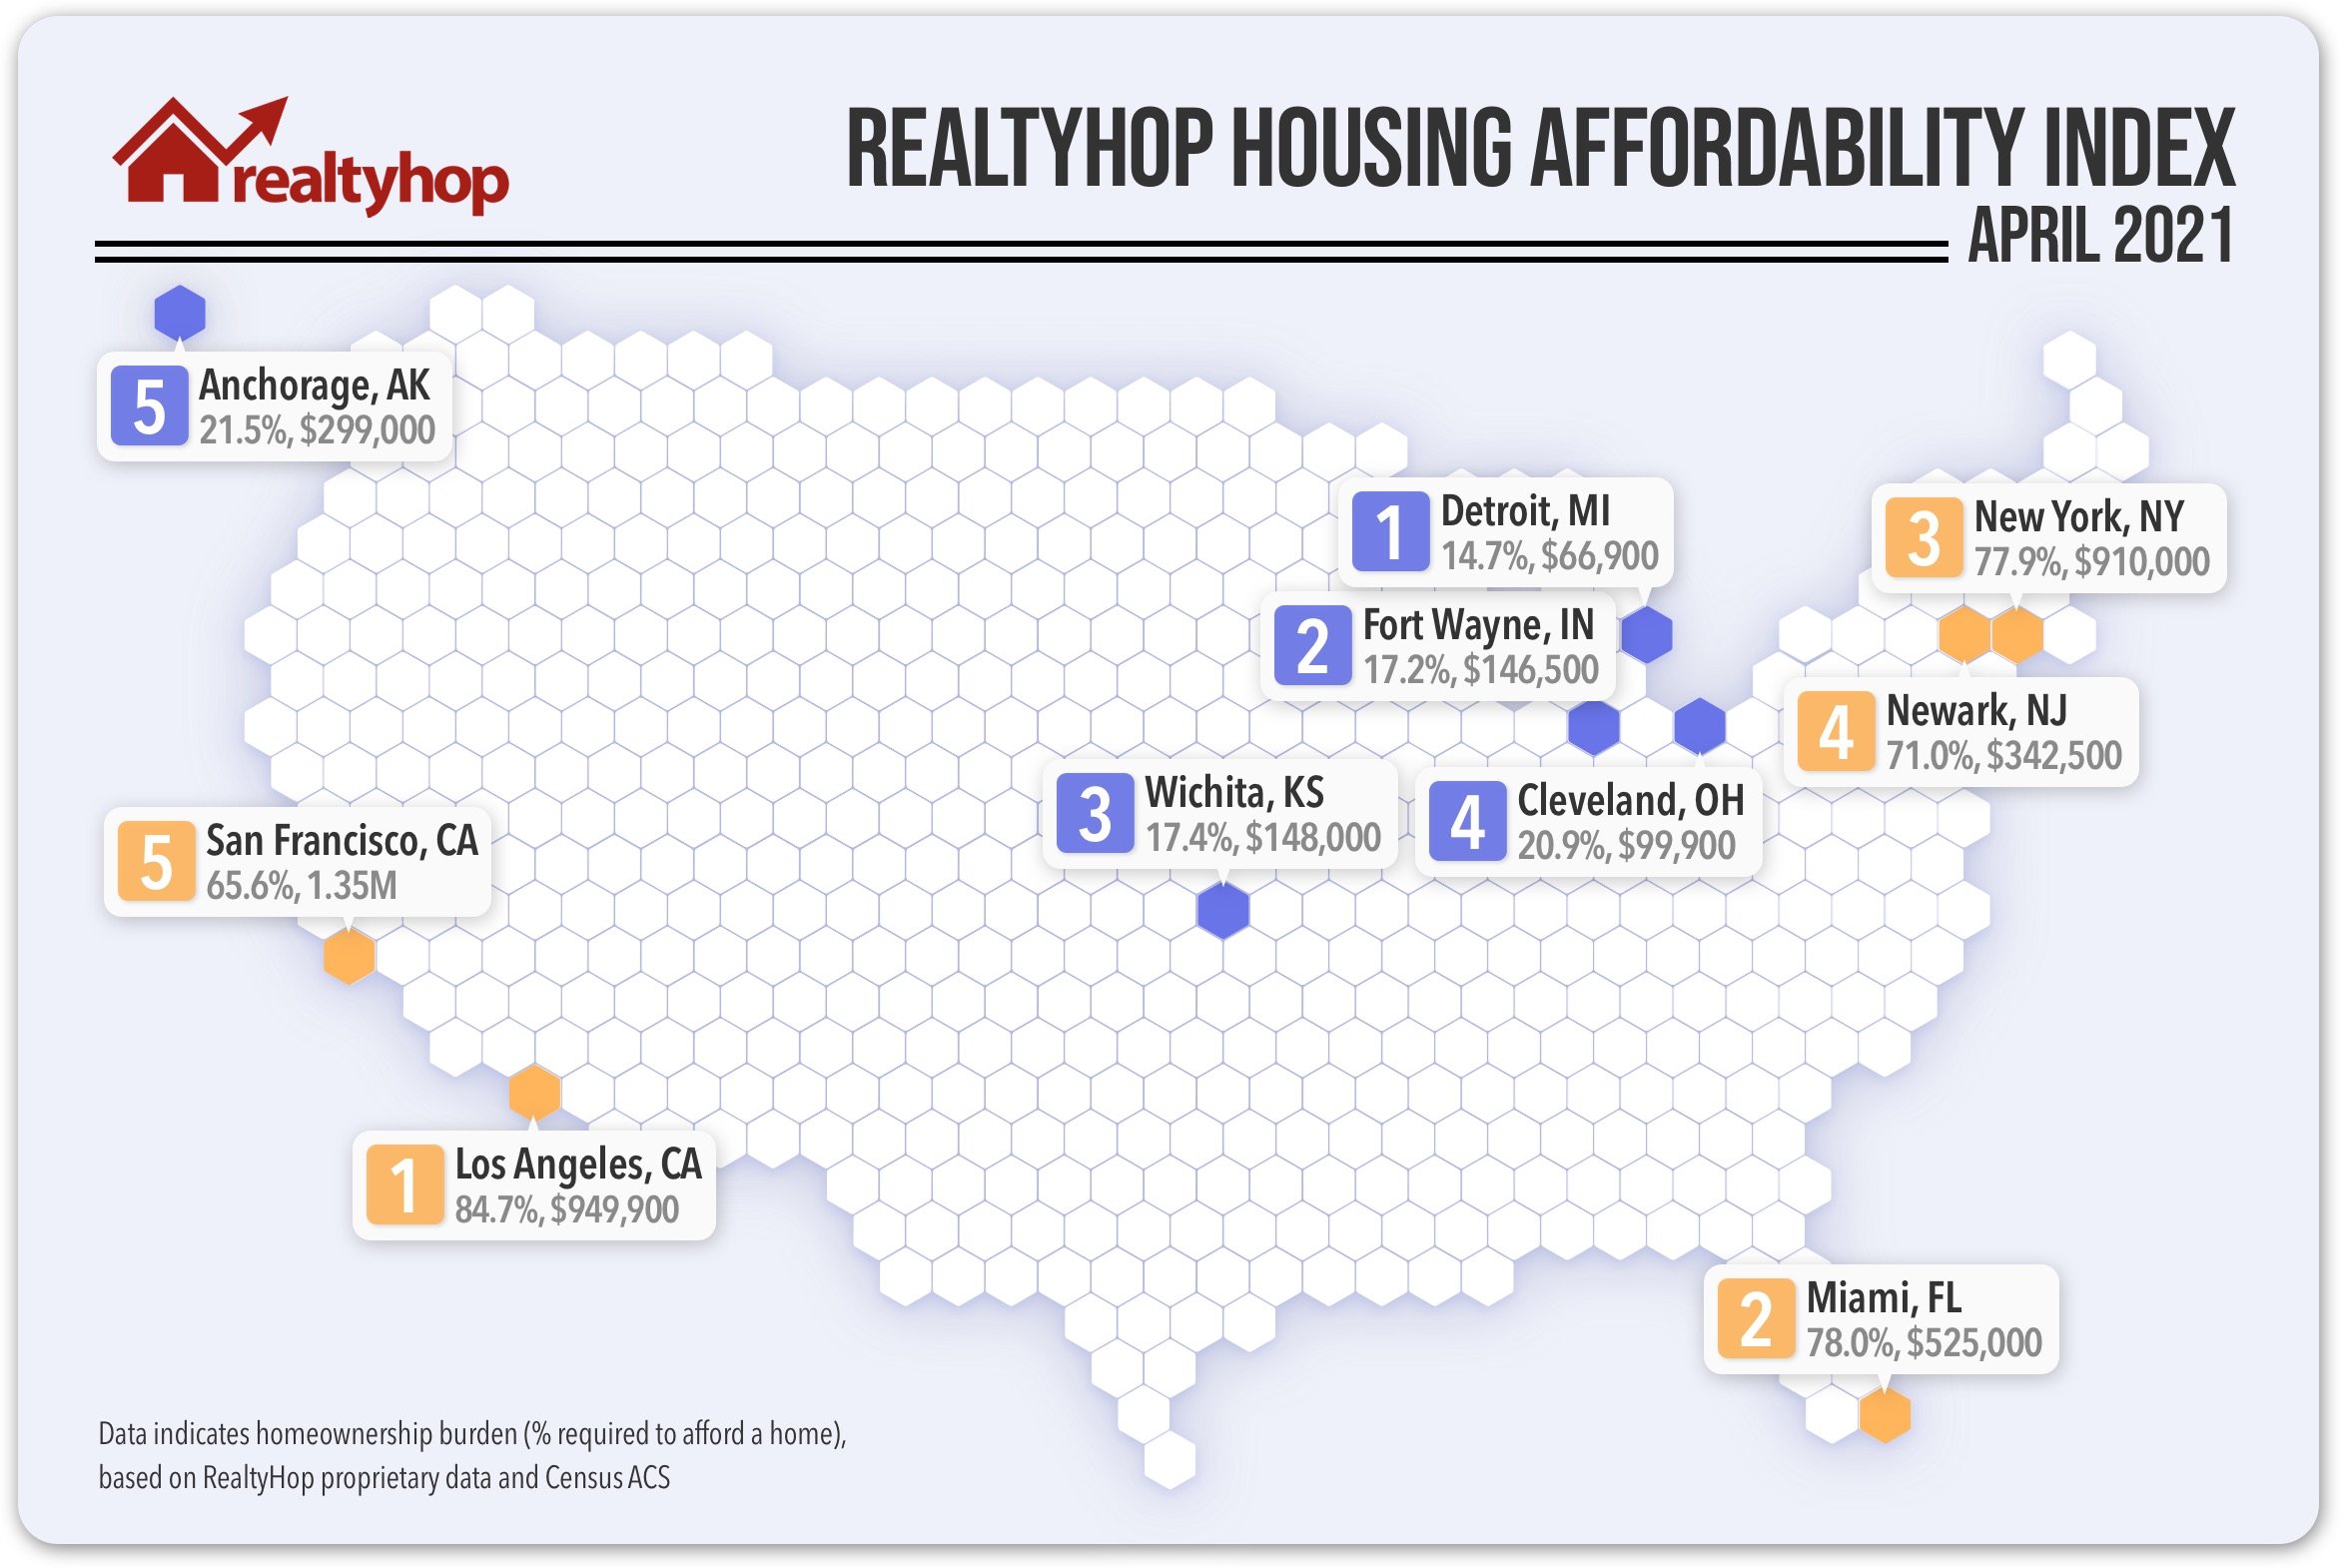
1. Los Angeles, CA once again topped all major U.S. cities as the least affordable housing market this month. Even with a median household income of $62,142, a family in L.A. would have to spend 84.70% of their annual income to own when factoring in mortgage rates and local taxes.
2. Miami, FL remained the second least affordable city for U.S. homebuyers. Given median household incomes of $39,049, alongside home prices of $525,000, an average household looking to own would need to spend 77.89% of income toward mortgage and tax costs.
3. New York, NY has consistently been the third most cost-burden city in the U.S. Despite a median household income of $63,998, a family in New York City would have to set aside 77.88% of annual income, or $4,153.36 per month, to own a home.
4. Newark, NJ remained the fourth most expensive U.S. city for owning. The median asking price in Newark hit $342,500, driving up the city’s index by 3.63% this month. A family in Newark can expect to spend 71.01% of their income towards the costs of homeownership.
5. San Francisco, CA was again the fifth least affordable city in the nation this April despite the city’s strong income of $112,449. With a median asking price of $1,350,000, a family looking to own would have to allocate 65.56% of their annual income toward mortgage repayments and taxes.
The 5 Most Affordable Housing Markets
1. Detroit, MI was the most affordable U.S. city for families looking to own. When factoring in property taxes, monthly principal and interest, and the median asking price of $66,900, a family in Detroit would only need to spend 14.72% of their annual income to own.
2. Fort Wayne, IN remained stable as the second most affordable city in the nation, despite a slight increase in housing prices over the period. A family looking to buy would need to spend only 17.20% of their income on housing, 0.45% more than the previous month..
3. Wichita, KS came in as the third most affordable housing market. Median asking prices fell to $148,000, leading to an average monthly payment of $761.96, or 17.38% of a household’s income.
4. Cleveland, OH was the fourth most affordable city this April, increasing one spot on our affordability ranking. With median real estate values of $99,000, a family making median income in Cleveland should expect to spend just 20.89% of their income on housing costs.
5. Anchorage, AK rounded out our five most affordable markets. The city became less affordable, with median asking prices reaching $299,000 this month. A family would need to spend $1,522.11 per month, or 21.51% of their annual income, to own a home in the city.
Notable Changes This April
Boise, ID jumped 11 spots this month to become the 23rd least affordable city, as the city’s homeownership index increased 2.49%. This change was caused by the strong demand, which led to a hike in real estate prices — median asking went from $399,000 to $424,000 over the period.
Fremont, CA experienced a rise in real estate values this month. Median asking prices went from $1M to $1,099,000, driving the city’s index up by 4.14% and making it the 16th least affordable housing market in the country.
Stockton, CA became less affordable this April. Strong demand from buyers put upward pressure on home prices in the city, further increasing the city’s affordability index by 3.50%.
Methodology
The RealtyHop Housing Affordability Index analyzes both proprietary and ACS Census data to provide an index of housing affordability and homeownership burden across the 100 most populous cities in the country. Median home prices are calculated using over 300,000 listings in the RealtyHop database over the month prior to publication.
To calculate the index, the following statistics are used:
1) Median household income from the U.S. Census
2) Median for-sale home listing prices via RealtyHop data
3) Local property taxes via ACS Census data
4) Mortgage expenses, assuming a 30-year mortgage, 4.5% interest rate, and 20% down payment.
See below for previous RealtyHop Housing Affordability Studies:
RealtyHop Housing Affordability Index: March 2021
RealtyHop Housing Affordability Index: February 2021
RealtyHop Housing Affordability Index: January 2021