Around two years ago, Mayor De Blasio signed a series of bills to help reduce the number of smokers in New York City. In June 2018, the City officially raised the base price for cigarettes to $13 a pack, and what does that mean? To smokers, it means your habit (or addiction) is getting more expensive. To the government, it translates into less tax revenue. New York as a state has seen some significant dips in total cigarette sales tax collections. Maybe people are really quitting, or maybe they are going somewhere else for their cigarette packs. But in general, it does seem that the legislation has drastically reduced the number of smokers in the City. Smoking rates in New York City, according to the government, have declined from 21.5% in 2002 to 14.3% in 2015, and their current goal is to achieve a historically low rate of 12% by 2020. How are New Yorkers responding to their City’s endeavor, though? What does the data say about New Yorkers’ attitude toward smoking? Since we at RealtyHop love data and maps, we thought we’d look into smoking violations in New York City to see if New Yorkers are in line with their Mayor to make the City less “smoky”.
In this Report:
- We assumed that, since the total number of smokers has been decreasing in New York City, more smoking violations reported indicate that New Yorkers are less and less tolerant of smoking and the use of e-cigarettes.
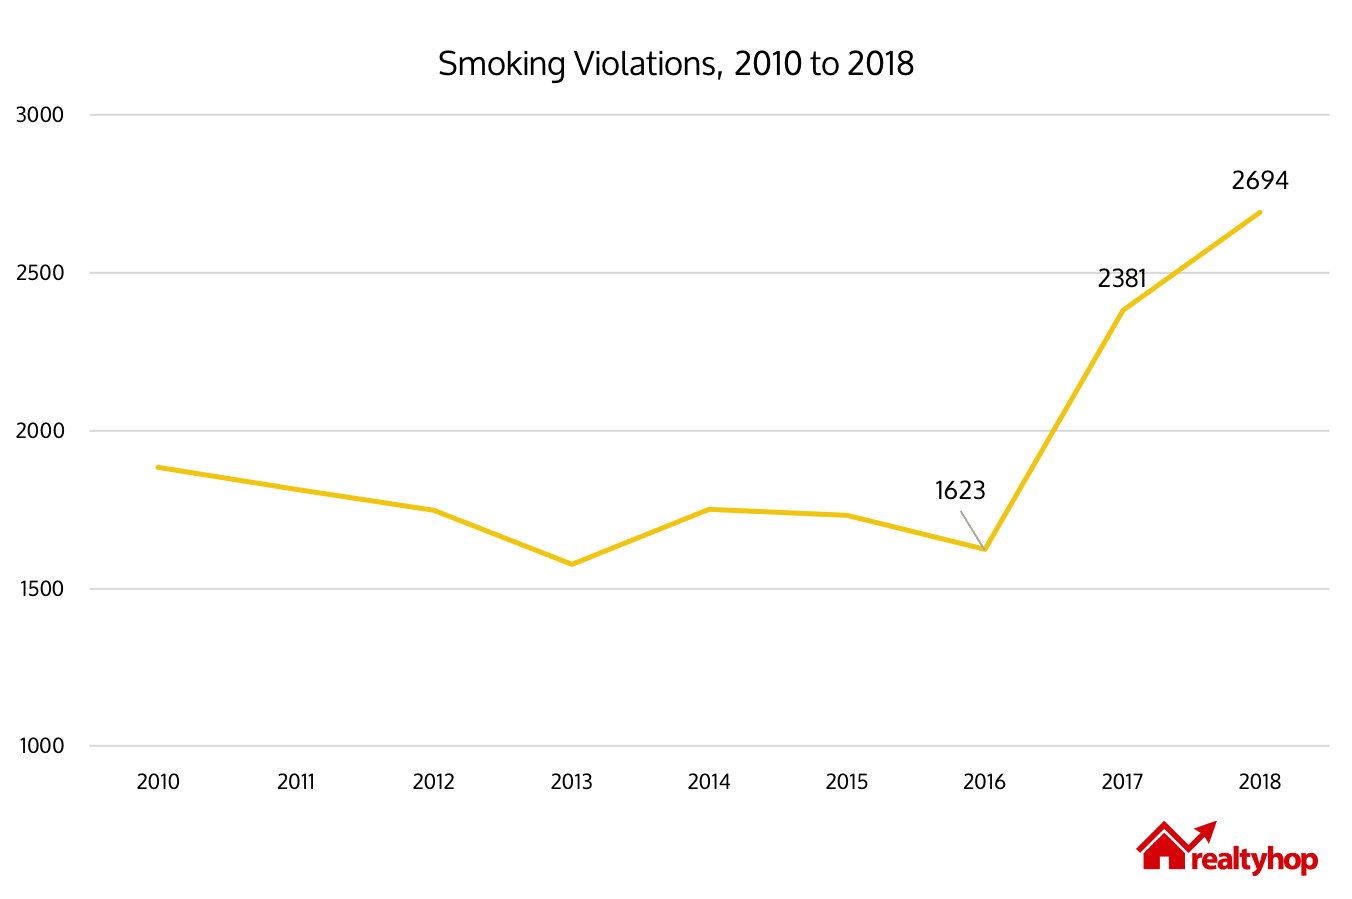
- The number of smoking violations has gone up since 2016, from 1,623 to 2,694 in 2018. As of March, the city has seen 640 smoking violations this year. (Figure 1)
- Among the five boroughs, Manhattan had the most smoking violations per Sq Mi in 2018, with a total of 838 violations filed. (Figure 2)
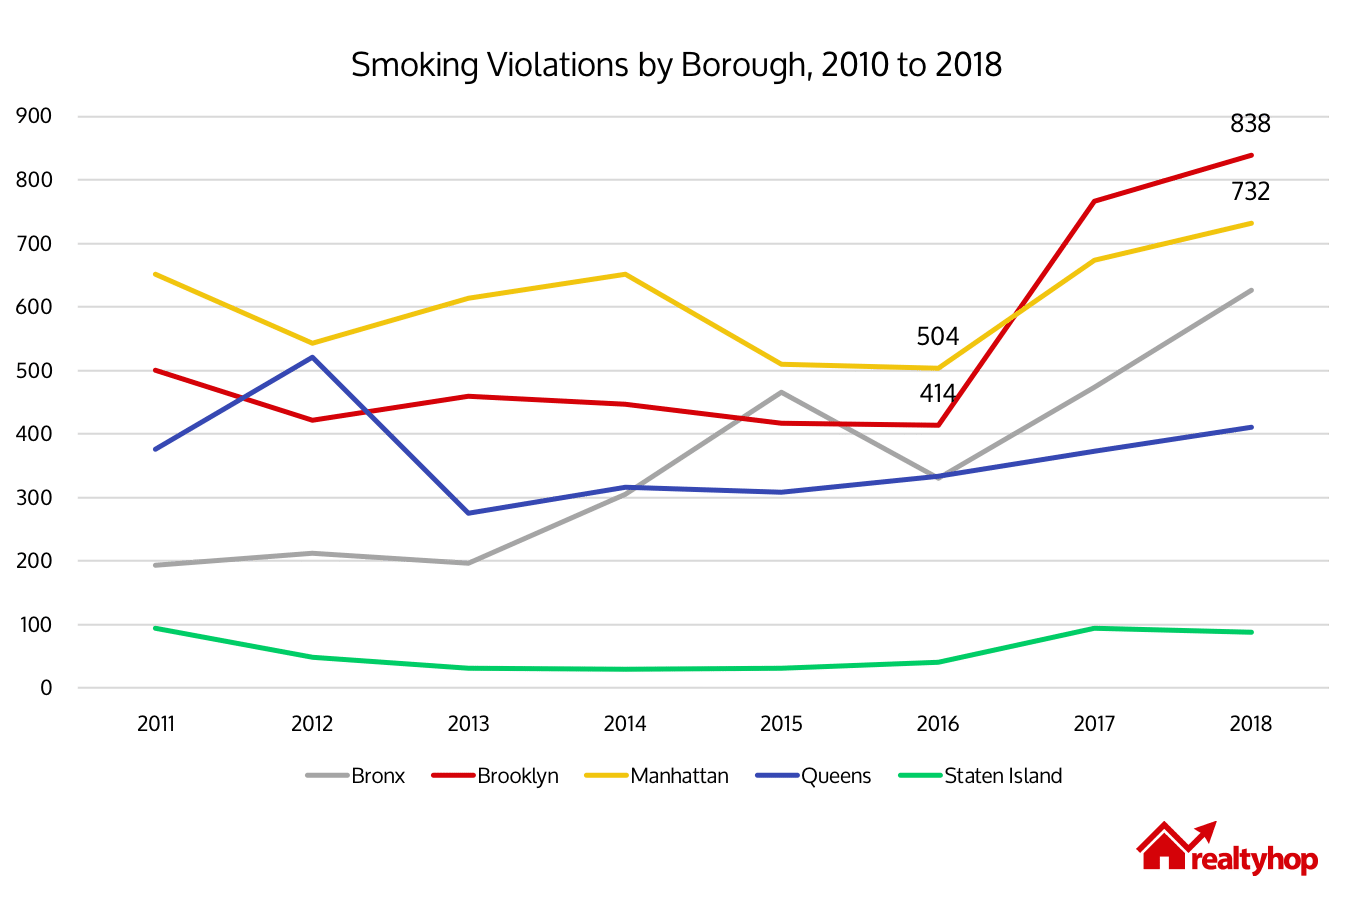
- Brooklyn had the most number of smoking violations in 2017 and 2018, and the increase is outpacing other boroughs. (Figure 3)
- We found a negative correlation between the number of smoking violations and homeownership within a zip code. In other words, if more units are owned in a zip code, fewer smoking violations are filed. (Figure 4)
- More smoking violations occured during the wintertime (January, February, and March) than summer. (Figure 5)
To begin, let’s first ask this question – what is considered a smoking violation? Smoking, including the use of e-cigarettes, is banned virtually in all workplaces, close to hospital entrances, and in city parks, beaches and pedestrian plazas. In residential buildings, while private space is not regulated, residents are not allowed to smoke in the common areas. Through NYC Open Data, we were able to track all smoking violations reported since 2010. To make sure that repeated same-day callers about the same incident do not tilt the data, we removed duplicates by time, date, and address. In total, the City has had 17,873 smoking violations since 2010, of which over 10,000 involve residential buildings. To rank fairly among neighborhoods, we normalized the number of violations by the number of households within a neighborhood, according to the most recent Census data available. As one would assume that an area with more households will also have more complaints, normalizing the data using the number of households allows us to correct such bias.

Our goal was to see if the number of smoking violations has gone up in the past few years. We assumed that, since the total number of smokers has been decreasing in New York City, more smoking violations reported indicates that New Yorkers are less and less tolerant of smoking and the use of e-cigarettes. Figure 1 summarizes the data by year, from 2010 to 2018. As we can see, the number of smoking violations soared after 2016, from 1,623 to 2,694 in 2018. That’s a 65% increase in two years!
| Total Violations |
2017 Violations |
2018 Violations |
2019 Violations |
2017 Violations/Sq Mi |
2018 Violations/Sq Mi |
|
| The Bronx | 3,127 | 474 | 626 | 114 | 11.3 | 14.9 |
| Brooklyn | 5,024 | 474 | 838 | 249 | 10.8 | 11.8 |
| Manhattan | 5,770 | 674 | 732 | 176 | 29.5 | 32.1 |
| Queens | 3,379 | 373 | 410 | 92 | 3.4 | 3.8 |
| Staten Island | 544 | 94 | 88 | 9 | 1.6 | 1.5 |
Figure 2 and Figure 3 (below) summarize the data by borough. All boroughs have seen an increase in the number of smoking violations from 2016 to 2018. While Brooklyn has had the most number of poop complaints since 2010, it is not the worst when it comes to smoking violations. Manhattan, as of March 2019, has seen over 5,700 smoking violations, making it the winner of our smokiest award in both 2017 and 2018 based on the number of violations per square mile. When taking a closer look, however, we can clearly see that Brooklyn has outpaced New York in the past two years. The number of smoking violations, since 2016, has been increasing in the most populous borough, from 414, to 766 in 2017, and to 838 in 2018. As of March 2019, Brooklyn has received 249 smoking violation complaints.

NYC Neighborhoods, by Level of Smokiness
Areas with darker shades have higher concentrations of smoking violations. (Yes, we’ve tried different shades of gray to mimic the smokiness, and it only made the map look hopelessly depressing…. So here we are, presenting you a map with some happy yellow shades.) Unlike what we’ve seen with our previous studies, the correlation between the number of occurrences and proximity to the city center doesn’t exist when it comes to smoking violations. However, the assumption that neighborhoods with more apartment buildings tend to receive more smoking violations seems to hold true.
These are the Smokiest Neighborhoods
- Fordam South, the Bronx – 69.56 Average Yearly Violations/Per 10,000 Households – 116 violations in 2017, 113 in 2018, and 20 in 2019 as of March.
- Midtown-Midtown South, Manhattan – 45.60 Average Yearly Complaints/Per 10,000 Households – 95 violations in 2017, 59 in 2018, and 16 in 2019 as of March.
- Chinatown, Manhattan – 22.37 Average Yearly Complaints/Per 10,000 Households – 26 violations in 2017, 93 in 2018, and 25 in 2019 as of March.
- Stuyvesant Heights, Brooklyn – 19.21 Average Yearly Complaints/Per 10,000 Households – 246 violations in 2017, 112 in 2018, and 80 in 2019 as of March.
- Astoria, Queens – 18.84 Average Yearly Complaints/Per 10,000 Households – 33 violations in 2017, 72 in 2018, 10 in 2019 as of March.
These are the Healthiest Neighborhoods
- Arden Heights, Staten Island – 0.11 Average Yearly Complaints/Per 10,000 Households – no violations in the past 3 years.
- Cambria Heights, Queens – 0.16 Average Yearly Complaints/Per 10,000 Households – no violations in the past 3 years.
- Rosedale, Queens – 0.25 Average Yearly Complaints/Per 10,000 Households – 1 violation in 2017, 1 in 2018, and 0 in 2019 as of March.
- Stuyvesant Town-Cooper Village, Manhattan – 0.29 Average Yearly Complaints/Per 10,000 Households – 1 violation in 2017, 1 in 2018, and 0 in 2019 as of March.
- St. Albans, Queens – 0.39 Average Yearly Complaints/Per 10,000 Households – 3 violations in 2017, 2 in 2018, and 0 in 2019 as of March.
Smoking Violations vs. Homeownership
While we didn’t find any correlation between geographical location and proximity to the city center, we did, however, notice a correlation between the number of smoking violations and homeownership. Figure 4 illustrates the significant negative correlation (r= -.2123) between average yearly violations per 10,000 households and whether a unit is owned. With p = 0.0031, it is unlikely that the correlation we found is a coincidence (whenever p-value is less than 0.05 it is likely not a coincidence). Indeed, correlation does not equal causation, but we do get a glimpse into what types of neighborhoods tend to have more smoking violation occurrences. Maybe rental apartment buildings have more common areas, and therefore, more smoking violations? Maybe homeowners are less likely to report a smoking violation?

When Does the City see the Most Smoking Violations?
Since we at RealtyHop are so obsessed with data, showing where the smoking violations are was not enough. We also wanted to know when. Figure 5 shows the number of smoking violations by month, cumulated from 2010 to March 2019. Did you know that the city experiences fewer smoking violations in the summertime, from June to September? Maybe people are more cheerful and happier when the weather is warm, and therefore smoke less? Maybe New Yorkers tend to enjoy outdoor activities more in the summer, that they don’t notice the smoking violations in their buildings as much? One cannot say from the available data. What we do know, is that when winter comes around, the number of smoking violations soars. March has been historically the top month, with 1,954 smoking violations filed, followed by February, with a total of 1,918 occurrences from 2010 to March 2019.

50 Most Reported Addressees with Smoking Violations
The table below shows 50 buildings with the most smoking violations – you can type in your neighborhood and/or borough and see if there are a lot of smoking violations around you.
